An overall analysis of the occurrences of the most powerful registered earthquakes (MPREs) – of a magnitude 8.5 and higher – makes it possible to trace the geological similarity of the areas where they appear. Namely, all of them occurred at the continental crust or at least at the very edge of it. Significantly, most of them occurred near very specific parts of the subduction zones, just where the Mesozoic oceanic crust, the Cenozoic oceanic crust, and the continental crust meet, or where the Mesozoic crust, and Cenozoic crust are nearby. The way in which the new Geological Map of the Ocean Floor was built, gives a unique opportunity to trace this conformity (Fig. 1). Table 1 presents an up-to-date list of the MPREs and shows the approximate distances from their epicentres to the nearest Mesozoic and Cenozoic oceanic crusts, and also to the edges of the continental crust.
|
Table 1* |
15 most powerful earthquakes with a Richter scale** of 8.5 or greater |
|||||||
|
No. |
Geographical Location |
Coordinates of the Epicentre |
Magnitude |
Year |
Approximate Distance from Epicentre to: |
Category |
||
|
Subduction Zone (km) |
Mesozoic Oceanic Crust (km) |
Cenozoic Oceanic Crust (km) |
||||||
|
1 |
Chile |
38.24S, 73.05W |
9.5 |
1960 |
175 |
1700 |
175 |
III |
|
2 |
Prince William Sound, Alaska |
61.02N, 147.65W |
9.2 |
1964 |
550 |
2675 |
550 |
|
|
3 |
Andreanof Islands |
51.56N, 175.39W |
9.1 (8.6***) |
1957 |
200 |
125 |
200 |
I |
|
4 |
Northwest Coast of Sumatra |
3.4N, 95.78E |
9.0 |
2004 |
150 |
350 |
150 |
|
|
5 |
Kamchatka |
52.76N, 160.06E |
9.0 |
1952 |
150 |
150 |
750 |
|
|
6 |
near Sanriku, Japan |
39N, 143E |
8.9 |
1933 |
125 |
125 |
475 |
|
|
7 |
off coast of Ecuador |
1N, 81.5W |
8.8 |
1906 |
0 |
2500 |
0 |
IV |
|
8 |
Rats Islands |
51.21N, 178.5E |
8.7 |
1965 |
150 |
200 |
150 |
I |
|
9 |
West Coast of Sumatra |
1.9N, 96.66E |
8.7 |
2005 |
100 |
500 |
100 |
|
|
10 |
Assam, Tibet |
28.5N, 96.5E |
8.6 |
1950 |
75 |
900 |
1650 |
II |
|
11 |
Gansu, China |
36N, 105E |
8.6 (7.8***) |
1920 |
1475 |
2325 |
2300 |
|
|
12 |
Hakkaido Island |
42.5N, 144E |
8.6 |
1952 |
225 |
225 |
325 |
I |
|
13 |
Kamchatka |
54N, 161E |
8.5 |
1923 |
200 |
200 |
550 |
|
|
14 |
Banda Sea |
5.05S, 131.62E |
8.5 |
1938 |
325 |
25 |
100 |
|
|
15 |
Kuril Islands |
44.9N, 149.6E |
8.5 |
1963 |
150 |
150 |
225 |
|
|
* Compiled from UNESCO GMW1; GMOF 2nd Ed.2; PDE, USGS3; B. Bolt4; H, Kanamori5; C. Lomnitz6 |
||||||||
|
** Any data related to earthquake magnitude prior to the introduction of the Richter scale were commonly evaluated using other scales or by calculations stemming from the observed destruction, which were often inaccurate. Only two such earthquakes are listed in this table *** Disputed magnitudes |
||||||||


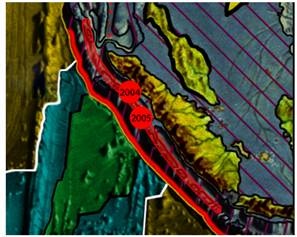
Figure 2 – The 9.0 magnitude earthquake (2004) and 8.7 magnitude earthquake (2005) off the West Coast of Sumatra island, with the epicentre located approximately 150 km and 75 km north of the Java-Sumatra subduction zone and approximately 350 km and 500 km from the triple junction of the Mesozoic oceanic crust, the Cenozoic oceanic crust, and the continental crust, respectively.
The proposed way of classifying the MPREs reveals that almost 67 percent of them occurred near – from 25 km to 750 km – areas that have a specific geological similarity, that is, where the Mesozoic oceanic crust meets the Cenozoic oceanic crust, and where there are subduction zones nearby – from 100 km to 325 km (Category I in Table 1). All of the MPREs occurred at the continental crust.
Fig. 2 represents an area where two such earthquake happened; one in December 2004 at the northwest coast of Sumatra island and generated the greatest post-earthquake tsunami in human memory, and a second one – in 2005.
Another eight of the fifteen MPREs also fit into the above category of earthquakes, that is, the Category I classification in Table 1. The remaining five MPREs can be included in one of the following three categories: Category II – earthquakes in the Himalayan-Tibetan region – about 13 percent; Category III – earthquakes that take place near the subduction of the Cenozoic oceanic crust under the continental crust – also about 13 percent; Category IV – earthquakes that are close to the triple junction of the continental crust, the Cenozoic oceanic crust, and the Plio-Quaternary oceanic ridges – only seven percent.
It seems, however, that the possibilities inherent in the way of classifying MPREs that has been presented may provide a small but significant chance to approach a bit nearer to the prediction of earthquakes. That might seem to be the case if such a large percentage – almost 67 percent of MPREs – belonging to Category I in Table 1’s classification, did occur in areas with such specific geological similarities.
The phenomenon of earthquakes has been analyzed in this work by drawing a correlation between the occurrence of MPREs and the distances of their epicentres from the Mesozoic and Cenozoic oceanic crusts. Such an earthquake prediction method may not be effective yet for the prediction of the time of earthquakes. This method has already achieved some positive results, however, and has been an opportunity to note that the great majority of MPREs did occur in similar and very specific geological areas. It has provided an occasion to at least mark the planet’s areas of highest seismic risk. The format of the presented abstract does not give an opportunity to insert the compiled list of all cities and islands that are located at the world’s most dangerous areas. At least, the presented Geological Map gives a possibility to show the areas with the highest seismic risk of the planet.
REFERENCES
- UNESCO, 2000. Geological Map of the World, 2nd Edition. CGMW and UNESCO Publ.
- Granton Institute of Technology (GIT), 2005. The 2005 Modification of the 2004 Geological Map of the Ocean Floor. Granton Institute of Technology Publ.
- PDE (Preliminary Determination of Earthquakes) Monthly Listings, USGS, Golden, CO.
- Bolt, B.A., Earthquakes, W.H. Freeman and Co., 1993. New York, New York, 270-273 pp.
- Kanamori, H., The Energy Release of Great Earthquakes, 1997. J. Geophys. Res. 82, 2981-2987.
- Lomnitz, C., 1994. Fundamentals of Earthquake Prediction, John Wiley & Sons, New York, New York, 286-293 pp.