AISA Eagle II
AISA Eagle II is a hyperspectral VisNIR pushbroom imager manufactured by SPECIM. The instrument operates by looking down in a fixed direction and imaging successive lines of the flown scene, building up a two-dimensional image as the platform moves forward (main parameters are described in table 1.
| FOV (o) |
37.7 |
| no. FOV pixels |
Configurable 512 or 1024 |
| no. spectral pixels | Configurable up to 256 |
| spectral range (nm) | 400-1000 |
| focal length (mm) | 17.8 |
| GSD @ 2500 m (m) |
1.5 |
Table 1. AISA EAGLE II main parameters.
DMC-I
DMC is a high-resolution photogrammetric frame camera, manufactured by Z/I imaging (currently Hexagon) (Dörstel 2003), which simultaneously captures one high-resolution (HR) panchromatic and four low-resolution (LR) multi-spectral (red, green, blue and near-infrared) images (main parameters are described in table 2).
| FOV (o) | 69.9×42 |
| no. FOV pixels | 13824×7680 |
| no. spectral pixels | 3072×1920 |
| spectral range (nm) | 1 panHR / 4(RGBNir)LR |
| focal length (mm) | 120(panHR)/25(LR) |
| GSD @ 2500 m (m) | 0.25(panHR)/1(LR) |
Table 2. DMC I main parameters.
Data acquisition
Methodology begins with an appropriate flight plan. Data is acquired in a single nocturnal flight where both sensors (AISA and DMC) are operated simultaneously in an airborne platform, which is able to carry both sensors.
As the goal is the analysis of artificial nocturnal lights, it is required to avoid natural light sources, which means avoid moon light. Because of that flight is performed close to the New Moon phase or the nights when moon has been already set.
Luminance map
This section is dedicated to the description of the retrieval of luminance from the hyperspectral sensor and later fusion with the photogrammetric camera data.
Luminance Map (retrieved from Hyperspectral sensor)
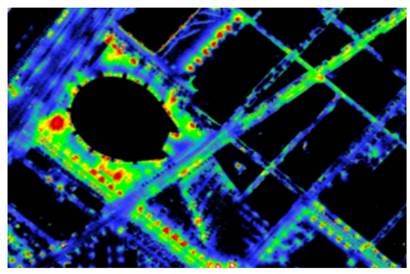
For each pixel, the VisNIR sensor collects a spectral sampling of the radiation in 400-900 nm spectral range emitted by the surface. As luminance map must represent how the human visual system perceives the radiance of light at ground level, the radiance values of the 126 AISA sensor bands must be converted to luminance values at ground level and then combined in a way which mimics the visual perception of human beings. The conversion from measured radiance to luminance at ground level is performed in several steps. Firstly, a radiometric calibration converts digital numbers captured by VisNIR sensor into radiances at flying height. These radiances are transferred to radiances at ground level by compensating for atmospheric hyperspectral attenuation and combining the 126 radiances recorded per pixel using the photopic luminosity function. Finally, a low resolution luminance map (at a resolution of 1.5 m GSD) of the entire area is created by mosaicking the flight tracks of the hyperspectral sensor. Figure 1 shows a detail of the low resolution luminance map segmented into 10 classes from 0.35 to 10 cd/m2.
DMC and AISA data fusion
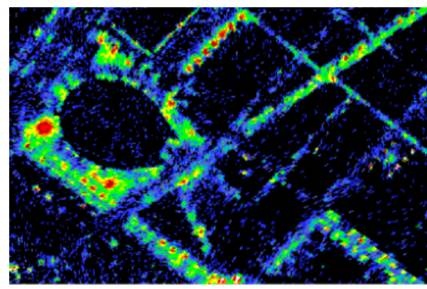
The fusion consists of fitting the radiance values of DMC images to the luminance map retrieved from the hyperspectral sensor. Once this calibration process has been completed, the luminance map at 0.25 m GSD can be computed from DMC imagery alone. Figure 2 shows a detail of the high resolution luminance map segmented into 10 classes from 0.35 to 10 cd/m2.
 |
 |
Figure 1. Low resolution luminance map derived from AISA Eagle II hyperspectral sensor. |
Figure 2. High resolution luminance map derived from the AISA Eagle II and DMC-1 fusion. |
Concerning the luminance absolute estimation, the radiometric information was preserved in the DMC map generation process. Notice that it is easy to verify that the information retrieved using the AISA for luminance values higher than 1.5cd/m2 has been preserved. Moreover, the lower noise floor of DMC has enhanced the dynamic range of the retrieved luminance from 1.5 cd/m2 down to 0.35 cd/m2.
Light source type map
Hyperspectral and multispectral airborne sensors have been often used for nocturnal image analysis. Yet, all these studies have been focused on the detection of artificial light sources or classification based on specific spectral signature detection.
As shown in figure 3, artificial light sources have specific spectral signatures. The hyperspectral capabilities of the AISA Eagle II sensor allow deriving a set of spectral indexes focusing in particular features of the light spectral signatures, which are used to discriminate them.
.")
In order to overcome the relatively low intensity of artificial light at night, it has been designed a two steps strategy. Firstly, punctual source lights and their illuminated neighborhood are detected in the DMC nocturnal images. Secondly, a set of light spectral indexes is computed as a weighted average of spectral indexes derived from the AISA hyperspectral data. Taken profit of the different spectral signatures of the light sources (fig 3), a set of indexes has been derived.
The next figure (figure 4.) shows a detail of the resulting light source type map. Classification is as follows: in yellow high-pressure sodium lamps, in orange metal-halide lamps, in blue mercury vapor lamp, in green fluorescent lights, in violet LED lamps, in red halogen or incandescent lamps and in grey not classified lamps.