Moreover, these hazards and risks are likely to change in the coming century due to the effects of climate change. Computerised climate models predict sea level rise and an increase in storm intensity and frequency.
The aim of RESPONSE is to set up a transferable methodology for evaluating and mapping those coming changes in coastal hazards and risk, on a regional scale, in order to give guidelines to national and local authorities to anticipate risk changes.
RESPONSE is part of the LIFE environment demonstration program ; It is carried out, under the leadership of Isle of Wight Centre for the Coastal Environment, UK (IWCCE) with a partnership of research organisations in, France (BRGM) and Italy (CNR) and end-users in the UK (SCOPAC, Scarborough Borough Council), France (maritime services), Italy (Regione Marche, Provincia di Macerata, Provincia di Pesaro e Urbino) and Poland (Maritime Office Gdynia).
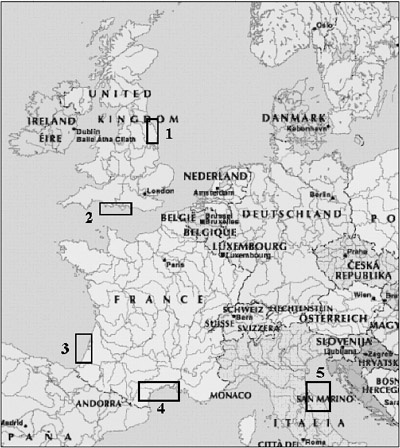
The methodology is developed and adapted to the 5 following coastal pilot regions (Figure 1).
-
England: North Yorkshire(1) and South-central coast(2)
-
France: Aquitaine(3) and Languedoc-Roussillon (4) in France,
-
Italy: Marche (5)
This paper is focused on the French application of the methodology.

Figure 1. Location of the pilot regions in Europe (“© European Community, 2006).
MAPPING EXISTING DATA TO DEFINE “COASTAL BEHAVIOUR SYSTEMS”
The first step of the study was to collect and map existing data . 3 sets of existing data were collected and mapped using Arcview 9.1 GIS.
-
Data on coastal geomorphology and existing defences (hard and soft)
-
Data on known historical events underlining coastal hazards
-
Data on coastal dynamic processes;
These data sets are mainly issued by
-
EUROSION Databank (2004) and Observatoire de la côte Aquitaine for coastal geomorphology, existing defences and coastline
-
IGN BdCarto for administrative limits
-
Aquitaine and Languedoc Roussillon DIREN GIS , and CORINE Land Cover (1990) for data on protected habitats
-
CNEXO paper published data and SHOM for bathymetric and hydrodynamic data
-
SMNLR , EID Méditerranée, SM33 and DDE40 for coastal hazards events
The compilation of data and maps allowed coastal units to be drawn which have, in the present day, a coherent response to coastal hazards, more specifically to erosion, landsliding and marine flooding, so called “Coastal Behaviour Systems” (Figure 2).

Figure 2. Definition of Coastal Behaviour Systems (CBS).
Each detailed ‘Coastal Behaviour System’ (CBS) can been elaborated by agglomerating items describing the morphology of its shoreface, of its shoreline, presence or absence of defences, and geomorphology of its hinterland, items stored in the GIS database. Computerised CBS have been counterchecked by experts, with the help of oblique photographs (www.franceview.fr), orthophotoplans of the coastal zone (@ortholittorale2000) and IGN scanned maps (1/25000).
The following figure (figure 3) lists the different landform elements encountered in the French pilot regions, which were used to describe the detailed CBS. In order to simplify the drawing, these were “globalised” under 6 colour classes named after the most characteristic landform.

Figure 3. Detailed and global Coastal Behaviour Systems.
CHOOSING CLIMATE CHANGE SCENARIOS
All climate change models proposed by IPCC (2001) , based on different schemes of global socio-economic evolution in the coming century, predict a sea level rise, and an increase intensity and frequency of storms. The predicted ranges of sea level rise varies, between 10 and 88 cm in 2100, dependent on the model (Figure 4).

Figure 4. Global average sea-level rise between 1990 to 2100 for each SRES (IPCC source).
Applying the different global hypotheses as a test In France showed that although taking the pessimistic hypothesis (88 cm) enhanced the results, it was the most coherent within the aims of the project, which aims to identify “hotspots” and inform the responsible authorities with regard to anticipation and planning.
The pessimistic hypothesis of 88 cm of sea level rise was therefore chosen, and added to regional current context of potential marine flooding (the highest known storm surge and the highest tidal level).
It gives a estimated maximum sea level above IGN zero level of 5.8 m for Aquitaine and of 2.7 m for Languedoc Roussillon.
Increase in storm intensity and frequency is applied on an empiric basis.
MAPPING COASTAL HAZARD AND RISK CHANGES
The next step is to evaluate changes in coastal hazard and risk due to climate change (figure 5).

Figure 5. Mapping hazard and risk changes.
For each detailed ‘coastal behaviour system’, a cross evaluation of hazard change is made by an expert committee, considering the climate change scenario described above. No CBS have been considered to be subject to decreased hazards in the French pilot regions.
The change is marked 0 (no change-which does not mean no hazard), 1 (significant increase) or 2 (drastic increase). In some cases, modification of the system can also be anticipated (beach loss, underwater bar loss,…). Scoring relates to predicted erosion, landslide and marine flooding hazards.
These marks are compiled on a map taking the maximum mark of the different estimated hazards, and present-day hazards (so far that they are known) are also computerised on the map, as a reference point for potential change.
Human and natural assets have been mapped from data extracted from CORINE Land Cover data base, IPLI data base, Aquitaine and Languedoc Roussillon data bases.
The coastal risck change map is produced by comparing this assets map with the map of potential hazard change . Assets are considered at risk when included within a 300m wide buffer drawn behind coastline marked as subject to a hazard increase (1 or 2) (Figure 6).

Figure 6. Draft map of Southern Aquitaine coastline (Côte Basque) showing assets at increased risk within a 300 m zone, behind coastline subject to increased hazard, within the coming century.
PRELIMINARY INTERPRETATIONS AND CONCLUSION
At this stage of the RESPONSE project only preliminary exploration of the GIS results have been made.
It should be remembered that this study is based on hypotheses and models that will have to be confirmed in the future (IPCC,20001). The results have to be considered, at a regional scale, as guidelines for future coastal management planning, and will have to be adjusted when better knowledge on climate change is developed. Figures given in table 2 are to be considered as range of order.
It should also be remembered that only hazard change is considered here to evaluate the risk change. Assets are also likely to increase in the coming century, with a prospective increase of population in coastal towns (INSEE, 1999).
In the two French pilot regions, preliminary interpretation shows (table 2):
-
For Languedoc-Roussillon: an increase of both erosion and flood hazard , significant to drastic, for most of the low-lying coast, half of which is backed by heavy urban and tourism developments.
-
For Aquitaine (excluding Arcachon basin and Gironde estuary), a mostlysignificant increase in erosion risk, mainly along some of the cliffed coast, where assets are concentrated, and most of the tourist towns along the sandy coastline.
This study underlines that climate change impacts on coastal risk must be considered in any coastal management project, on a regional or site specific scale, to assess the cost/benefit analysis that should accompany such projects.
|
LANGUEDOC ROUSSILLON |
AQUITAINE |
|||
|
Significant hazard increase(1) |
Drastic hazard increase (2) |
Significant hazard increase (1) |
Drastic hazard increase (2) |
|
|
Coastline subject to increased risk (% of total regional coastline) |
25% |
60% |
94% |
5% |
|
Significant risk increase |
Drastic risk increase |
Significant risk increase (1) |
Drastic risk increase (2) |
|
|
Coastline subject to increased risk (% of total regional coastline) |
8% |
28% |
43% |
3% |
Table 1. Range of order of coastal hazard and risk increase in both studied regions.
ACKNOWLEDGEMENTS
The RESPONSE project is part of the LIFE Environment demonstration program and received European funding.
It is the result of a fruitful partnership between the above quoted organisms, which allows an effective synergy and refinement of the methodology throughout the project.
Acknowledgments have also to be given to the Maritime service of Languedoc Roussillon, EIDMéditerranée, Maritime service of Gironde, Departmental direction of Equipement of Landes for their help in collecting data, and sharing of their knowledge of the coastal environment.
The French BRGM team has been an active partner in this work and the authors wish to thank Nicole Lenôtre, Carlos Oliveros and Rodrigo Pedreros, for their expert advice, participation in cross-evalutions, and reviews.
REFERENCES
- IPCC, 2001. Intergovernmental Panel for Climate Change third assessment report.
- 2003, Orientations stratégiques pour la Gestion de l’érosion en Languedoc-Roussillon. Service Maritime Languedoc Roussilon.
- CORINE Coastal erosion, 1990.
- CORINE Land Cover, 1990.
- EUROSION, 2004.Vivre avec l’érosion côtière en Europe. Espaces et sédiments pour un développement durable. Conclusions de l’étude EUROSION.Office des publications officielles des Communautés européennes.
- INSEE, 2005. Littoral Aquitain. Diagnostic de territoire.