Usually, land use cartographic studies performed by means of satellite image data require multispectral imagery from different seasons or dates and process methodology use to be pixel oriented. Nowadays, the latest high resolution sensors and that ones coming in the future, together with the new existing data process environments, lead to important changes in the classification methodology (Manakos et al., 2000).
In the present study, new information related to the terrain objects height and derived from LIDAR data has been incorporated to the multispectral high resolution images. LIDAR data is quite different from the data coming from other remote sensing sensors. It consists of irregular points with three-dimensional coordinates instead of an array of pixels. The Digital Terrain Model (DTM) and the elevation of the objects on the terrain, as trees and buildings, are easily obtained from LIDAR. The height of the trees is quite valuable information, but up to the advent of LIDAR it was difficult to obtain and land use maps are usually done without taking it into account. The objective of the study is to test the improvement of this kind of maps with the use of LIDAR data.
The selected software tool was eCognition attending to its advantages in order to relate different resolution objects (Mansor et al., 2002). Since it makes possible a kind of textural data analysis, it permits also to obtain classifications with semantic legends closer to that one existing for many land use maps, and it is even able to quantify the existing heterogeneousness for specific categories.
1. STUDY AREA AND DATA
1.1 Study Area
The study area corresponds to the map sheet 807 of the 1:50000 series from Spain. The area covers an extension of 36 km by 26 km (figure 1). It is fundamentally dry farming land, with a 39% of forest surface, predominantly scrublands; the 28% corresponds to dehesas (grassy pastureland dotted with holm oaks and cork trees), the 14% to meadows, the 13% of herbaceous crops, and the remaining surfaces containing small extensions of olive groves and irrigated fields. Besides, the 3% of the surface is covered by the water of a reservoir and there are also three small towns.
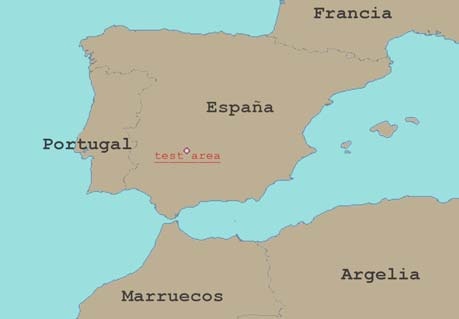
Figure 1. Situation of the study area.
1.2 LIDAR Data
The LIDAR sensor was the Optech ALTM 3025 on board of the plane Partenavia P68-C Observer both of them property of the Institut Cartogràfic de Catalunya. Table 2 summarizes the LIDAR survey parameters. The LIDAR sensor records first and last echo and the intensity of each echo but the LIDAR intensity values have not been used in this study. The survey was done on December 13, 2004 and consisted of 21 parallel strips with 30% overlap (see figure 3). Data gaps correspond to water.
|
|
Setting |
| Velocity (knots) | 135 |
| FOV (degrees) | 34 |
| Scan frequency (Hz) | 19 |
| Pulse repetition (Hz) | 25,000 |
| Height above ground (m) | 2300 |
| Strip overlap (%) | 30 |
| IFOV (mrad) | 0.2 |
| Point distance along track (m) | 1.8 |
| Point distance across track (m) | 2.1 |
| Footprint diameter (m) | 0.46 |
Table. LIDAR survey parameters
In addition, two transversal strips were flown over three, almost flat, control fields. On each control field, between 40 and 50 points where measured with GPS/RTK with an estimated accuracy of 2-3 cm.
A least squares adjustment was performed to obtain an elevation offset for each LIDAR strip following the procedure described in (Kornus et al., 2003).
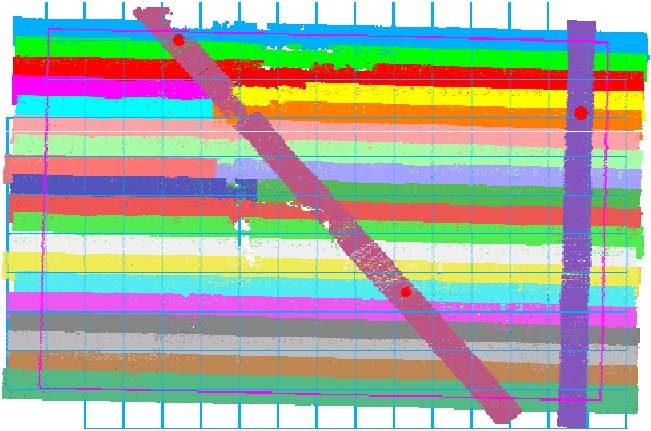
Figure 3. LIDAR strips and control fields (red dots).
1.3 Multispectral Data
The area of study was captured by the satellite Quickbird providing three different images (figure 4) during the winter of the year 2005: 26/01/2005 (p0002 and p0003) and 23/02/2005 (p0001).
The Quickbird spectral bands are:
Channel 1: 450 nm-520 nm (blue)
Channel 2: 520 nm-600 nm (green)
Channel 3: 630 nm-690 nm (red)
Channel 4: 766 nm-900 nm (near infrared)
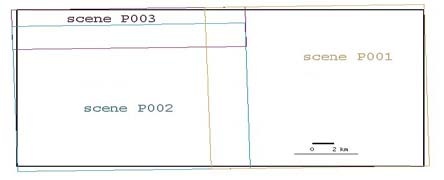
Figure 4. Schema of Quickbird images.
2. DATA PRE-PROCESSING
2.1 LIDAR process
After the corrections of systematic errors, the last echo LIDAR points were automatically classified into ground and nonground points with TerraSolid and TerraModeler software from TerraSolid.
The original algorithm is described in (Axelson, 2000). The program starts with a crude approximation of the terrain and refines it iteratively adding more and more points to the TIN surface. The vertices of the first approach are selected from a 60 m. GSD grid. Then, the program adds new points that meet two criteria: they do not increase the surface slope too much and they are not too far from the previous surface. At each iteration the thresholds are computed from the data.
After that, the resulting classification was edited by trained operators. The LIDAR data precision was checked in 6 test fields, with 20 points each, measured with the GPS/RTK technique (see Table 5). The points measured in the field were compared to the elevations obtained by interpolation on a triangulated irregular model (TIN) of the terrain obtained from LIDAR points classified as ground.
Next, a Digital Terrain Model (DTM) of the bare ground was interpolated from the TIN model and a Digital Surface Model (DSM) including vegetation and buildings was computed by assigning to each cell of the DSM the elevation of the highest first echo LIDAR point inside. Both of them had a 2 m. GSD.
The difference between the DSM and the DTM gives the height of the vegetation and buildings or Digital Tree Height Model (DTHM), (Hyyppä et al., 1999). First attempts of classification using this DTHM and the Quickbird image produced difficult to explain results because the height of isolated trees in the DTHM ranged from 0 at tree borders to the height of the tree at some point of the crown. To solve this difficulty, the standard hydrological technique was used to detect the trees, delineate the crowns and to assign the height of each tree to the polygon representing its crown (Hyyppä et al., 1999), (Hyyppä et al., 2000). This processing was done with the hydrological analysis tools available in Arc/Info. The first step was done by changing the sign of the DTHM and low pass filtering it. Each tree corresponds to a local minimum or a sink in the reversed DTHM. The area that drains to each sink corresponds to the crown of the tree. In the study area there are many isolated trees and for that reason it was considered that each crown ends when the height reaches one third of the total tree height as done in a previous work (Ruiz et al., 2005).
|
Test area |
Vegetation | N | Mean of differences (m) | sigma (m) | RMS (m) |
| 1 | Grass | 20 | 0.001 | 0.044 | 0.043 |
| 2 | Olive trees | 16 | 0.067 | 0.043 | 0.079 |
| 3 | Grass | 20 | -0.009 | 0.046 | 0.046 |
| 4 | Grass | 19 | -0.008 | 0.084 | 0.083 |
| 5 | Grass | 19 | -0.039 | 0.048 | 0.061 |
| 6 | Olive trees | 21 | 0.066 | 0.029 | 0.072 |
| Total | 115 | 0.012 | 0.064 | 0.065 |
Table. LIDAR TIN model accuracy.
2.2 Quickbird geometric geocoding
Quickbird images were geometrically corrected by using the Rational Polynomic Coefficients (RPC) provided together with the images and using the DTM derived from LIDAR data. A shift was required to obtain a final good enough overlapping for the purposes of this study. The geometrical adjustments and image rectification was performed using ICC software tools.
3. DATA PROCESSING & CLASSIFICATION
After analyzing the particular characteristics of the area of study and to realize that mono-temporal spectral data would not permit to identify the different herbaceous covers, the analysis was directed to evaluate the remaining classification possibilities in relation to the use of DTHM and textural processes.
On the one hand, the combination of the objects height and its spectral information should theoretically make easy to separate urban areas from bare soil. Very often these land use classes present spectral confusion, as well as the woodlands with respect to the herbaceous cover. On the other hand, if we could quantify the objects (trees, for example) inside homogeneous landscape units it would be possible to differentiate some categories. This is the case with trees that regarding the different spatial distribution and density should be distinguished between pastures, dehesas and forest.
For the analysis with eCognition the four Quickbird spectral channels and the DTHM layer derived from LIDAR were employed. The final methodology was split in three processing phases or steps:
- First Phase: Perform a very fine segmentation (level 1) for the establishment of a simple and detailed cartography of the image objects. The generation of a high-resolution cartography of trees and buildings is the main goal.
- Second Phase: Perform a rough segmentation (level 3) to obtain a low-resolution cartography in order to characterize the landscape units according to the tree density (Ivits et al., 2002).
- Third Phase: Derivation of the final land use/cover cartography using an intermediate segmentation (level 2) in which the results from previous steps are analyzed and combined.
A sub-scene from the study area can be seen in figure 6. It displays the DTHM layer and the overlaid outlines from the three segmentation levels on the false colour Quickbird image. The yellow polygon corresponds to a low-resolution segment from second phase.
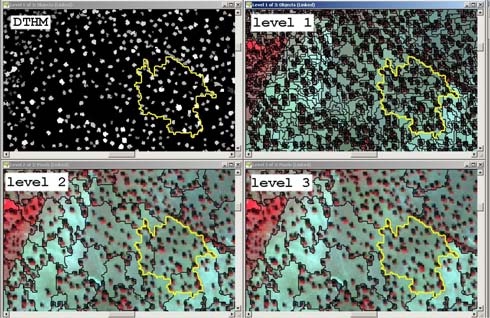
Figure 6. DTHM & segmentation levels.
To obtain suitable segments in each phase it has been required to set very different segmentation parameters in each level. As an example, the colour factor in level 3 was very small and compactness factor was increased in an attempt to obtain big enough objects representing the landscape units. Meanwhile, colour factor was important at level 1 segmentation.
A classification using brightness, DTHM and NDVI was performed in level 1 segmentation, resulting into cartography with six categories shown in figure 7 (bottom-left). Both right quadrants correspond to the DTHM. Without the DTHM it is not possible to classify vegetation by height and, consequently, is very difficult to distinguish between brushes and trees. A similar confusion occurs between buildings and bare soil. With LIDAR we can even classify by tree height. In bottom-right the trees between 2 and 3 meters are shown in colour.
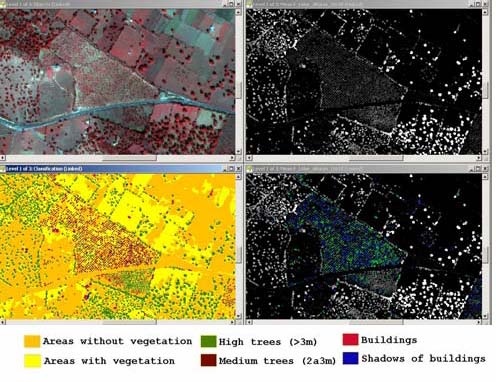
Figure 7. First Phase results.
The Second Phase (figure 8) uses level 3 segmentation. Two derived variables were computed from level 3 and level 1 segments: trees density and predominance. The trees density was computed for each level 3 segment by dividing the total number of trees detected in level 1 by the segment area. Predominance variable corresponds to the ratio between high and low trees.
After the photointerpretation of theses variables, four trees density classes were defined: more than 80 trees/ha, between 50 and 80, between 20 and 50, and less than 20. The join classification using both variables lead to distinguish seven categories: three area types corresponding to the trees density (high, medium and low) which are subdivided according to the high or low trees predominance. Seventh class corresponds to areas with less than 20 trees/ha.
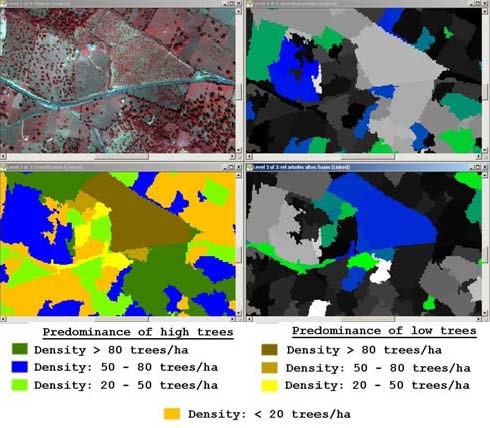
Figure 8. Second Phase results
Figure 8 shows some results from the Second Phase processing. Top-right shows in light grey and white the segments with higher densities and dark colours correspond to lower density segments. Colour segments in bottom-right are those with low trees dominance.
Third Phase requires the level 2 segmentation and begins by differentiating the forested areas from the others (intermediate NDVI values and low Brightness). Next, the relations between the categories cartographied for levels 1 and 3 were analyzed for each segment. The eCognition ability to label a segment as a function of its characteristics in other segmentation levels allowed the establishment of the conditions for the classification of following categories: forest (three different sub-categories according to density), brushwood (three different sub-categories according to its density and, in addition, scrubland), meadow, olive trees, herbaceous (with or without active vegetal cover), bare soil and buildings.
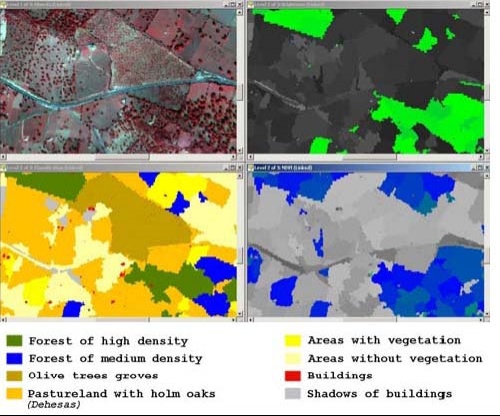
Figure 9. Third Phase results
Figure 9 bottom-left represents the Third Phase classification results for the same sub-scene. The right quadrants display in colour the segments accomplishing the established Brightness (top) and NDVI conditions (bottom), in order to characterize forested areas. Two different sub-scenes in the study area can be seen in figure 10. Left quadrants correspond to an urban area in a farming environment and right quadrants to a forested area.
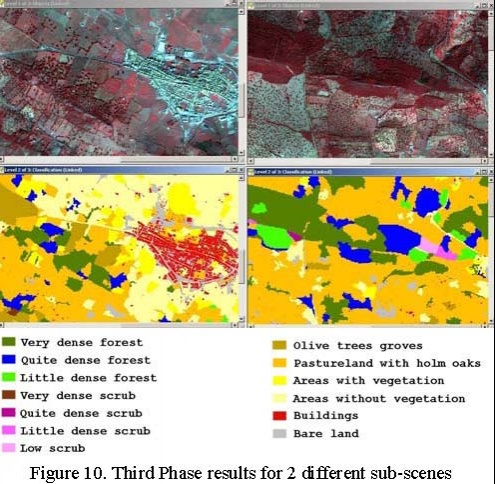
Figure 10. Third Phase results for 2 different sub-scenes
4. CONCLUSIONS
This paper presents the firsts results in a program conducted to the upgrading of the processes involved in the generation of land use/cover cartography. Potential innovations are analyzed with respect to the variables to be considered and also concerning the methodology to be used. In particular, the use of LIDAR data combined with monotemporal Quickbird imagery and its process by means of eCognition are tested.
Although the resulting land use cartography cannot be considered definitive and problems still remain, some conclusions may be exposed.
The participation of a DTHM layer during the classification proces is considered to be very positive. The tests carried out indicate that the introduction of this variable in the classification processes allowed an important improvement in the object characterization, avoiding many confusions caused by the exclusive use of the spectral information. Furthermore, its information contribution (height of the objects) opens new perspectives in the classification process and makes it possible the differentiation of up to now problematic categories.
The classification of high resolution images requires textural and contextual analysis in order to generate thematic maps with semantic classes. The high resolution of these images permits to identify the objects that constitute the landscape (trees, buildings). This fact demands the development of new processes for environment reconnaissance and its object integration. The development of classification tools or applications based on objects, instead of classification based on individual pixel features, becomes essential.
Finally, the use of high resolution information coming from different sensors requires, when object-based classification tools are utilized, an accurate geocoding. The different variables being combined in the analysis require a very good overlapping of the objects (trees, buildings) being detected.
5. FUTURE WORK
New versions of TerraScan allow a more reliable detection of buildings than previous versions. It is possible to detect them using LIDAR data only. Having a mask for the buildings might help to reduce the classification confusion between forest and buildings.
In this study only the tree heights and the area of the crowns has been estimated from LIDAR. It is possible to obtain also other variables describing the vertical distribution of the leaves and their density, but this has left for a future work.
6. REFERENCES
- Axelsson, P., 2000. DEM Generation from Laser Scanner Data Using Adaptive TIN Models. IAPRS 2000; 33(B4): 110-117.
- Hyyppä, J., Inkinen, M., 1999. Detecting and Estimating Attributes for Single Trees Using Laser Scanner. The Photogrammetric Journal of Finland, 1999; 16(2):27-42.
- Hyyppä, J., Hyyppä, H, Ruppert, G., 2000. Automatic Derivation of Features Related to Forest Stand Attributes Using Laser Scanner. IAPRS 2000, 33(B3): 421-428.
- Ivits, E., Koch, B., Blaschke, T., Waser, L., 2002. Landscape connectivity studies on segmentation based classification and manual interpretation of remote sensing data. eCognition User Meeting, October 2002, München
- Kornus, W., Ruiz, A. 2003. ”Strip Adjustment of LIDAR Data”. ISPRS Workshop “3-D Reconstruction from Airborne Laser-Scanner and InSAR data; October, 8-10, 2003, Dresden.
- Manakos, I. , Scheneider, T., Ammer, U., 2000. A Comparison Between the ISODATA and the eCognition Classification Methods on Basis of Field Data. IAPRS 2000; 33 (Supp. B7): 133-139.
- Mansor, S., Hong, W.T. and Shariff, A.R.M., 2002. Object oriented classification for land cover mapping. Map Asia 2002.
http://www.gisdevelopment.net/application/environment/overview/envo0010pf.htm (accessed 7 April 2006). - Ruiz, A., Corominas, M., Blanco, E., 2004. Aplicación de la tecnología lídar al estudio de la cubierta vegetal. 4º Congreso Forestal Nacional. September 26-30, 2005, Zaragoza, Spain.
7. ACKNOWLEDGEMENTS
This paper is part of a collaboration project between the ICC and the Instituto Geográfico Nacional (IGN).


