The detection of territorial changes, such as those derived from public works, is a keystone for the assistance to the scheduling of the cartographic updating projects. That is because updated cartography allows a better territorial management. For this reason the Institut Cartogràfic de Catalunya (ICC) develops a project aimed to the detection of actual territorial changes on satellite images on Catalunya (Spain) area.
The main variables to be obtained in the process are not static land use maps corresponding to each of the pictures in the series but the speed of territorial change in the area. In cartographic updating processes, the more interesting changes are the artificial ones. Those changes have special radiometric, morphologic and temporal period characteristic that have important influence in the methodology to detect them. Regarding radiometry, large artificial land modifications produce high radiometry variations due to the bare soil present during the change compared to most of the anthropogenic covers. With regard to morphology, there is a wide variety of shapes in the changes suitable to be controlled. They range from very compact shapes like urban areas, to pure lineal structures such as ground communication tracks. Finally, regarding the temporal period, the significant modifications for territorial management ranges from few months to several years. This is especially interesting on the areas where these changes are more frequent, basically around the cities and along the sea side.
Images acquired with satellite sensors are an adequate instrument for the analysis of territorial changes [1]. SPOT 5 images are suitable for this kind of studies because of the spatial, temporal and radiometric resolutions [2]. Regarding with spatial resolution, the SPOT 5 sensor is appropriate both in terms of nominal pixel size (Pan 2.5 m and MS 10 m) and swath size 60 x (60 to 80) km. Panchromatic band is especially interesting because of the spatial resolution, while the rest of the multiespectrals bands allow obtaining additional thematic information suitable to be added in the detection process. Finally, revisit time of the sensors is high enough to guarantee a full cover of the interest area (Catalonia has 31,930km2) twice a year.
Classical methodologies for change detection by means of satellite images are based on post-classifications or multitemporal classifications [3]. On the other hand, there is the possibility of performing the monitoring of the territory with a series of images using basic arithmetic procedures [4]. In this paper, we take a different approximation [1] by using a series of images to manage the territory and change detection, in such a way that new images allow confirming or refusing the results of the previous images.
Images included in the series to be used in the change detection are multitemporal. That means that each one was acquired with different illumination geometry and suffers from different atmospheric effects. Thus, it is essential to compensate the impact of each acquisition geometry and atmosphere state on the radiometry. At the end a set of atmospherically corrected and normalized images is finally obtained [5].
Moreover, there are natural and irrelevant changes for cartographic proposes as clouds, the cast shadows, and natural variations of water layers. Those must be previously detected and removed from the images. The set of images used in this kind of study suffer from the presence of sparse clouds. This kind of cloud casts a recognizable shadow on SPOT imagery as a result of the high spatial resolution of the sensor. Besides, the shadows of the clouds must be also delineated or they will appear as a huge change due to the reflectance shift in the differences image.
The objective of this paper is to set up a working methodology based on satellite images for the detection of real changes on the territory, suitable to be reflected on the updated cartography and a classification of the kind of changes detected. In the next section the proposed methodology for this study is explained. Then, the application area is introduced. Finally conclusions are shown.
1. Methodology
A. Atmospheric effect correction
Atmospheric correction of the images is performed by means of the methodology described by [5] and consists on the consecutive application of an atmospheric correction system based on a physical method and radiative transfer simulations, plus a statistical normalization method based on pseudo invariant areas that allows smoothing deviations not previously considered.
B. Geometric corrections of the images set
The image set is geometrically oriented in a simultaneous block adjustment using SPOT 5 geometric model [7] adjusted with a least squares algorithm by means of several ground control points and corresponding points between images, and it is geocoded using a nearest neighbor procedure in a 2.5m sized pixels for the pan band, and 10m sized pixels for the rest.
C. Discrimination of non-interesting covers
The proposed methodology to identify the clouds is based on two sources of information. First, the high reflectance of clouds in solar spectrum, that supposes and increasing of the reflectance compared with the mean reflectance of the series. Finally, the shadows cast on the ground by clouds produce a decrease on the reflectivity. From each source of information a mask is made applying a threshold criterion. The mask is supervised and linked together into a single mask that shows the real clouds detected with the alignment of clouds and shadows according with illumination geometry.
The methodology proposed for the detection of water layer is done in this study with a classical threshold method applied on SPOT band 3 reflectance, because in that spectral region there is a high contrast between water layers and general vegetation cover.
D. Generation of multitemporal RGB images and photo interpretation
The variations of the spectral signature are directly related to the variations of ground covers. After compensating for geometric and atmospheric influences during the acquisition, spectral signatures are supposed to be dependent only on the radiometric behavior of the observed surface. Thus, the radiometric differences that images show can be interpreted as real changes on the cover. For a proper observation of the differences we adopt the methodology of generating RGB images made from two SPOT pan images acquired on different dates. The multitemporal RGB images are generated with two of the SPOT available images. The older SPOT pan image is used to generate the red and blue bands and the other image generates the green band. This way it is possible to follow the evolution of the changes observed on the territory combining the information form different multitemporal RGB images.
Each multitemporal RGB image is analyzed by a photo interpreter to manually delineate the observed radiometric changes. As a result of the previous processes applied to the multitemporal RGB images, when the pair is observed the areas that do not have radiometric variations show grey shades. Otherwise, the areas that have modified its reflectance show green or magenta shades.
Images are analyzed by using Miramon GIS software [6]. This software allows delineating polygons that are saved in a vector format. Besides a data base is linked to the polygons including all the data related with the images, and a classification code for the change.
The photo interpretation of each pair provides areas were the radiometry has change along the time. All these information must be processed to obtain real changes on the territory.
The process of detection is based on the multitemporal RGB images. The methodology has been adapted from [1] to the three SPOT images from the different areas that were available. A three-step procedure has been applied:
- Step I: First and second SPOT pan images are used to make a multitemporal RGB image. On this image it is possible to delineate changes.
- Step II: Third SPOT pan image is used to confirm or deny the changes detected on the first step.
- Step III: Second and third SPOT pan images are used to make a new multitemporal RGB image. As in the case of the first step, on this image it is possible to delineate new changes.
In the future as new images are incorporated to the imagery set, the process will be extend by comparing changes with a multitemporal RGB image made with the new image and the pervious one. Besides, the new image will allow extending the confirmation of the previously detected changes.
2. Results
The main interest areas are three regions belonging to Barcelona (Spain) metropolitan area: Barcelonès, Baix Llobregat and Garraf. Then, the images selected to perform the analysis were Path 045 and Rows 266 and 267, for the following dates: 21-08-2005, 17-05-2006 and 03-09-2006. The image set has been geometrically corrected as it was described before.
The set of images was processed to eliminate the clouds and shadows and finally the natural water layer was removed for all the images to avoid blunder changes. Besides atmospheric correction algorithms were applied to normalize and improve the imagery radiometry.
B. General description of the changes
The first main result consists of the legend of changes that is possible to detect with the applied methodology. As the SPOT imagery has a good spatial resolution, after change identification the photo interpreter classifies the sort of the delineated changed. Thus, the main classes of detected changes are:
- Changes to non artificial covers: it includes all changes related with agricultural areas, bare soil, water layers, and different kinds of vegetation covers.
- Changes to artificial covers: it includes all changes related with urban area, industry area, roads, quarries, land movements and harbors.
C. Barcelonès area results
The Barcelonès area has an extension of 145.75 km2. It contains the city of Barcelona (Spain).
1) Step I (21-08-2005 to 17-05-2006)
There were 41 changed areas detected that represent 61.98 ha. This is 0.43% of the Barcelonès area and it is equivalent to 0.58% for a year. The most common change was bare soil to land movement with 18.30 ha. The second most important change was water to land movements with 17 ha, because of changes on the sea side.
2) Step II (21-08-2005 to 03-09-2006)
Former detections are confirmed with the new image.
3) Step III (17-05-2006 to 03-09-2006)
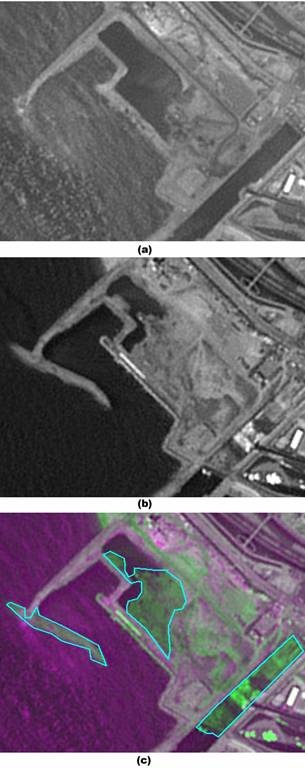
There were 70 new changed areas detected that represent 51.13 ha. That is 0.39% of the Barcelonès area and it is equivalent to 1.31% for a year. The most common change was bare soil to land movement with 13.26 ha. There is an example of Barcelonès area change on Figure 1.

Figure 1. Example of a change on Barcelonès area from water layer to land movements. (a) 17-05-2006 pan SPOT image. (b) 03-09-2006 pan SPOT image. (c) Delineated change on a RGB multitemporal image.
D. Baix Llobregat area results
The Baix Llobregat area has an extension of 485.99 km2. It is located in the south of Barcelonès area, and contains many dormitory towns and industrial parks.
1) Step I (21-08-2005 to 17-05-2006)
There were 236 changed areas detected that represent 476 ha. That is 0.98% of the Baix Llobregat area and it is equivalent to 1.33% for a year. The most common change was land movements to bare soil with 94.18 ha. The second most important change was agriculture area to land movements with 91 ha. There is an example of Baix Llobregat are change on Figure 2.
2) Step II (21-08-2005 to 03-09-2006)
Former detections are confirmed with the new image.
3) Step III (17-05-2006 to 03-09-2006)
There were 149 new changed areas detected that represent 134 ha. That is 0.28% of the Baix Llobregat area and it is equivalent to 0.94% for a year. The most common change was vegetal cover to bare soil with 27 ha. The second most important change was bare soil to land movements with 28 ha. All these changes are related with territory transformations.
E. Garraf area results
The Garraf area has an extension of 185.1 km2. It is located in the south of Baix Llobregat area, and contains many dormitory towns and a Natural Park.
1) Step I (21-08-2005 to 17-05-2006)
There were 14 changed areas detected that represent 110 ha. That is 0.60% of the Garraf area and it is equivalent to 0.81% for a year. The most common change was towards bare soil with 69 ha. The second most important change was vegetal covers to land movements with 24 ha.
2) Step II (21-08-2005 to 03-09-2006)
Former detections are confirmed with the new image.
3) Step III (17-05-2006 to 03-09-2006)
There were 23 new changed areas detected that represent 16.4 ha. That is 0.09% of the Garraf area and it is equivalent to 0.30% for a year. The most common change was vegetal cover to bare soil with 13.46 ha. There is an example Garraf area change on Figure 3.
F. Main difficult of the method
Although the minimum mapping area for the project is 1ha, there have been several changes considered with less than that cover surface as in the case of stone quarries. Specular reflections are a source of false changes and this is quite common on industrial areas. SPOT acquisition geometry can also generate artifact when comparing high buildings. Natural covers like vegetation are also a challenge because they are prone to generate blunder changes. For this reason main project development effort is placed on the automatic detection and marking off of false changes due to the seasonal evolution of the vegetation.

Figure 2. Example of a change on Baix Llobregat area from land movements to urban cover. (a) 21-08-2005 pan SPOT image. (b) 17-05-2006 pan SPOT image. (c) Delineated change on a RGB multitemporal image.

Figure 3. Example of a change on Garraf area from water layer to harbor. (a) 17-05-2006 pan SPOT image. (b) 03-09-2006 pan SPOT image. (c) Delineated change on a RGB multitemporal image.
3. Conclusions
A methodology for change detection on SPOT 5 images series has been applied with high accuracy with a 1 ha minimum mapping area on Barcelona metropolitan area. The obtained data has been processed and archived with Miramon GIS software. The results for the studied regions show that there have been an important amount of changes that ranges between 0.30 and 1.33% of the territory for a year with a mean value of 0.88% of the territory for a year. SPOT imagery has been proved as a good instrument to such a study because its spectral, temporal and geometrical resolutions. The detection methodology was found robust, so it was difficult that a real change went unnoticed. But a wide field for improvement is still open.
Acknowledgment
The authors are very grateful to the members of the Remote Sensing and Image Processing Area at ICC for their helpful suggestions.
References
- [1] L. Martínez, M. Joaniquet, V. Palà and R. Arbiol, «Detection, confirmation and validation of changes on satellite image series. Application to Landsat 7». Proceedings of the XXII International Cartographic Conference of the ICA. A Coruña, 2005.
- [2] http://www.spotimage.fr/html/_253_311_316_.php.
- [3] A. Singh, «Digital change detection technique using remotely-sensed data», International Journal of Remote Sensing, 10, 989-1003, 1989.
- [4] J.R. Jensen «Introductory Digital Image Processing: A Remote Sensing Perspective». 2nd ed. New Jersey, USA. Prentice Hall, 1996.
- [5] L. Martínez, V. Palà and R. Arbiol «Comparision of Standard, Radiosounded and Forecasted Atmospheric Data in a Solar Spectrum Atmospheric Correction System», IEEE International Geoscience and Remote Sensing Symposium, 21-25 july, 2003, Toulouse.
- [6] X. Pons «MiraMon. Sistema d’Informació Geogràfica i software de Teledetecció» Centre de Recerca Ecològica i Aplicacions Forestals, CREAF. Bellaterra. 2004.
- [7] ftp://ftp.spot.com/SPOT_docs/geometry_handbook/S-NT-73-12-SI.pdf.