During the last years, Synthetic Aperture Radar Differential Interferometry (DInSAR) has been widely developed and employed ([1]-[3]) proving to be an excellent tool for monitoring regional land surface movements. These techniques generate temporal deformation patterns of wide areas with sub-centimetric accuracy.
Under the auspices of Autonomous Government of Catalonia, the Institut Cartografic de Catalunya (ICCCartographical Survey of Catalonia) and the Institut Geologic de Catalunya (IGC- Geological Survey of Catalonia) share an operational project to identify, to monitor and to evaluate deformation episodes in the Catalan territory employing DInSAR.
In this paper, a description of the working methodology is done, paying special attention to the ICC-IGC interaction. Some DInSAR deformation results and recent advances in geological characterization and numerical modelling on the observed deformations in some test sites will also be presented.
1. Project Structure
The project started in 2007 and has an annual periodicity. A block diagram, showing the operational steps, is depicted in Figure 1. Light blue boxes correspond to ICC’s actions, dark blue to IGC’s and the red box to external public entities.

Figure 1. Block diagram of the project.
The ICC is in charge of planning the images acquisition. The first complete cycle consisted in acquiring the maximum number of available images in order to cover as much Catalonian territory as possible and make a first evaluation of the affected areas. As deformation results have been progressively generated, the new acquisition planning is done according to detected areas and to specific IGC demands considering the characteristics of location and movement pattern of the identified areas to be analyzed in detail. This causes the project not to be unidirectional but allows several interactions along the flux.
The ICC is also in charge of processing the data to generate the temporal deformation series and to make their in-house developed DInSAR and PS-DInSAR processors evolve. The progressive incorporation of new SAR and complementary data (such as ground truth data) allows to get quality seed points which improve the following processing. Furthermore, according to the detected deformation pattern, new recommendations in terms of temporal sampling, spatial resolution and working band are done for later data acquisition and processing.
The IGC compiles the geological and geotechnical characteristics of specific areas with land movements to contextualize and to interpret the PS-DInSAR results. This compilation is often made through geological studies, hidrogeological instrumentation and measuring campaigns. With all this information, the IGC correlates the observed movement with geological processes that might give origin to the observed land movement. That information is integrated into the geological hazard map and used on IGC hazard evaluation studies.
2. DinSAR Processing
Catalonia has an area of 31.930 Km2. C-band ERS and Envisat ASAR data have been progressively acquired to cover that extension. This accounts for 7 ascendants and 5 descendants frames. L-band ALOS-PALSAR images have been also acquired on the territory in order to cover moderately vegetated areas. Recent new SAR mission’s images, such as X-band TerraSAR-X and Cosmo-Skymed have been also incorporated into the project.
Once the stack of images is acquired, the corresponding stack of differential interferograms and their associated coherence maps are generated employing an in-house DInSAR processor. At this moment the processor is able to work with ERS, Envisat-ASAR, ALOS-PALSAR, Radarsat-2, TerraSAR-X and Cosmo-Skymed images. This processor includes the standard processing steps, such as image corregistering, image filtering and topographical term generation among others. Up to here, deformation studies on a single interferogram basis can be performed. Especially in large magnitude deformation episodes in non-urban areas, it is more useful to retrieve deformation from low temporal baseline interferograms instead of using a stack of interferograms. In that case, the filtered differential phase is unwrapped and transformed into a displacement map. The price to pay is that atmospheric artifacts may lower the quality of the deformation result.
To illustrate this, a high magnitude subsidence episode caused by underground mining in the Catalonian Potassicsalt basin is shown in Figure 2. From top to bottom, the differential phases of an ASAR (2005), a PALSAR (2008) and a Cosmo-Skymed (2011) interferogram are shown. Each fringe pattern corresponds to a potassium salt exploitation. Therefore, their evolution can be monitored along time.

Figure 2. Geocoded phase in rads. of ASAR (top), ALOSPALSAR (middle) and Cosmo-Skymed (bottom) revealing a surface subsidence (∼-30 cm/year) caused by mining activities.
Nevertheless the main objective is to generate the temporal deformation series of the studied areas. To this matter, an in house Persistent Scatterers DInSAR processor is applied to the stack of interferograms. This processor can be divided into three main blocks (similarly to other well known techniques ([1]-[3]). Firstly a pixel selection step is performed in order to select the quality pixels among the stack of interferograms. This can be either based on a coherence stability criterion (multi-looked interferograms) or in a dispersion of amplitude criterion (full resolution interferograms).
Then, the linear phase model components are calculated for every selected pixel. These account for the linear deformation velocity, DEM error and azimuth target position (under a dispersion of amplitude approach). The last block is devoted to estimate the non-linear motion component. To convert the interferometric time to absolute time, the Singular Value Decomposition method is employed. Therefore the output of the processor is a DEM error map, a linear velocity map and the temporal evolution of the deformation in each of the dates of the employed images. Once these results are generated, they are transferred to the IGC.
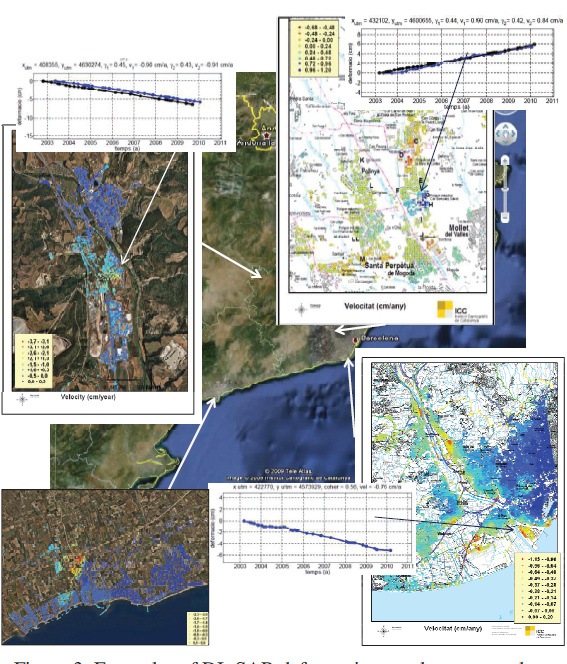
Some examples of these generated results over Catalonia are illustrated in Figure 3. The linear velocity maps from some areas are shown along with a sample of the retrieved temporal deformation of a selected point among them.

Figure 3. Examples of DInSAR deformation results generated within the project.
It is interesting to remark the benefits of working with SAR data coming from different sensors. Band combination allows optimization of the density of persistent scatterers in function of the area’s cover. At the same time, larger frequencies have more sensitivity to lower magnitude movements. New sensor’s high spatial resolution allows detecting high spatial gradient movements, difficult to detect for example, with ASAR data. In this sense, a two steps approach is adequate. Low resolution data from the archives is useful to have a first characterization of the affected areas and their deformation pattern. This allows the optimization of the dataset to be chosen for detailed study.
3. Geological Studies and Phenomena’s Description
Within the project, the IGC is responsible for classifying and verifying the ICC’s deformation results and for investigating the geological aspects that originates these phenomena. To assess the verification task, a precise topographical monitoring network is established in those locations whose deformation rates are large. This allows comparing both DInSAR and topographical results.
To identify in general terms the deformation triggering mechanisms, a review of geological conditions is done for every affected area. The first part reviews, the extension, magnitude and temporal evolution. Geological, hydrological and anthropic modifications aspects, as established by the UNESCO-ISOLS (http://isols.usgs.gov/), are revised and correlated with the extracted deformation. Finally, a list of potential mechanisms according to the HIS [4] is generated and some priority areas are proposed for detailed study.
The detailed study accounts for the compilation of all the existent geological, geotechnical, and hidrogeological information: stratigraphic columns, geological sections and in-situ prospecting (drillings, excavations, etc) are useful to establish a close correlation between the triggering mechanism and the geological materials of the affected area. Finally, in case enough information about the geomechanical description of the materials and the evolution of the deformation triggering mechanisms exists, a numerical model is generated. This allows generating and characterizing some critical scenarios and the intensity of the conditions of the phenomenon that generates land deformation.
Finally, the obtained results can be included in the hazard evaluation programs at a local or at a regional scale and also incorporated to the geological risk cartographical series of Catalonia at a 1:25000 scale [5].
3.1. Results and subsidence types in Catalonia
Two main deformation generator mechanisms have been identified at the affected areas in Catalonia: 1) evaporate deposits underground mining and/or karst phenomena, whose subsidence has already been taking place for years and it is well recognized in intense mining areas (towns of Súria, Cardona and Sallent among others) and 2) intense water extraction in detrital aquifers in quaternary sedimentary basins (Cambrils and the Deltaic area of the Llobregat river near Barcelona among others).
There are two specific study cases in which it has been possible to make general and detailed research. The first area is «la Estació» neighborhood in the town of Sallent. There, a subsidence movement has been reported since the 90’s. After different campaigns it has been possible to compile detailed geological, geotechnical and hidrogeological information that has allowed the quantification of the parameters that control the subsidence [6], see Figure 4.

Figure 4. (Top) Geological conditions of the La Estacion neighborhood in Sallent, R indicates the great cavity under it, (bottom left) cone subsidence model (bottom right) PS-DInSAR linear velocity map (cm/y).
The second study area is Sant Feliu de Llobregat, close to Barcelona. In this site there is a large density of water extraction wells which provoke a subsidence movement. As seen in Figure 5 there is a high correlation between DInSAR deformation and the phreatic level of the superficial aquifer in the area. Some hidrogeological and geological research along with geotechnical drilling and electrical tomography have been done in the area. From all these data it has been determined that the clay surface layer compression modifies its thickness with the water level variations. This has allowed developing some numerical models that simulate the observed cause and effect correlation, which is useful to evaluate critical scenarios under extreme conditions and their associated subsidence [7].

Figure 5. (Top) Linear deformation map, (Bottom) Piezometric level, Ps-DInSAR surface vertical movement and 1-D geotechnical evaluation at Sant Feliu del Llobregat test site.
4. Conclusions
In this paper a regional operational project in Catalonia (Spain) has been described with the objective to monitor surface deformation employing PS-DInSAR and evaluate its origin and impact on human population and structures. DInSAR has proven to be an excellent tool for identifying affected areas at wide spatial scale, difficult to detect employing «classical methods» but also, once they are identified, to perform a detailed study of them.
The interaction between two complementary institutions like the Cartographical and Geological surveys of Catalonia represents an added value, not only when evaluating the results but also to improve the PS-DInSAR processing strategy. The progressive incorporation of new SAR data with better features, together with a significant existent archive, yields a much better characterization of the deformation phenomena.
The systematic integration of the DInSAR results and the detailed geological analysis allows now and in the future a better understanding and quantification of the triggering mechanisms for hazard evaluation purposes.
- 5. References
[1] A. Ferretti, C. Prati and F. Rocca, «Permanent scatterers in SAR interferometry», IEEE Transactions on Geoscience and Remote Sensing, Vol. 39(1) pp. 8-20, 2001. - [2] P. Berardino, G. Fornaro, R. Lanari and E. Sansosti, «A New Algorithm for Surface Deformation Monitoring Based on Small Baseline Differential Interferograms», IEEE Transactions on Geoscience and Remote Sensing, Vol. 40(11) pp. 2375-2383, 2002.
- [3] P. Blanco, J. J. Mallorquí, S. Duque and D. Monells, «The Coherent Pixels Technique (CPT): An Advanced DInSAR Technique for Nonlinear Deformation Monitoring», Pure and Applied Geophysics, Vol. 165 pp. 1167-1194, 2008.
- [4] A. S. Allen, «Types of Land subsidence. Guidebook to studies of land subsidence due to ground-water withdrawal», United Nations Educational, Scientific and Cultural organization, Paris, France, pp. 133-142, 1984.
- [5] P. Oller, M. Gonzalez, J. Pinyol, J. Marturià, and P. Martínez, «Geohazards Mapping in Catalonia», Journal of Torrent, Avalanche, Landslide and Rock Fall Engineering, Vol. 74, pp.148-155, 2011.
- [6] F. López, P. Buxó, J. Palau, J. Marturiá, A. Concha and P. Martínez, «Evaluation of the subsidence and risk of collapse in the estació neighbourhood of the Sallent City (Spain)», Proceedings of VIII International Symposium on Land Subsidence, IAHS Press, pp. 170-172, 2010.
- [7] A. Concha, J. Ripoll, J. Piña, A. Gabàs and E. Piña, «Twodimensional coupled numerical modelling of subsidence due to water extraction at the Lower Llobregat River, Spain», Proceedings of VIII International Symposium on Land Subsidence, IAHS Press, pp. 136-139, 2010.