Encara que no gaire estudiats des dels àmbits de la geografia, els terratrèmols són fenòmens estretament lligats al territori, com poden ser els fenòmens meteorològics i, per tant, un element més de definició geogràfica.
A Catalunya aquest lligam és clar, doncs és l’Institut Cartogràfic i Geològic de Catalunya (ICGC) qui té la responsabilitat de desenvolupar i mantenir la xarxa sísmica i el servei d’informació sismològica i d’avaluació del risc sísmic de Catalunya. Aquesta tasca no es fa de manera aïllada i es manté una col·laboració estreta amb moltes altres institucions d’arreu del món, entre elles, l’International Seismological Centre (ISC), del qual, a més, l’ICGC n’és membre de ple dret des de l’1 de juliol de 2015.
L’ISC és una organització científica internacional no governamental, tutelada per la UNESCO i la IASPEI (International Association of Seismology and Physics of the Earth Interior). Té el seu origen en la primera xarxa sísmica mundial establerta pel famós sismòleg anglo-japonès John Milne a la fi del segle XIX. El seu objectiu principal és compilar i mantenir un butlletí de sismicitat global, considerat com el registre definitiu de la sismicitat de la Terra. Les dades es recullen a partir de més de 130 agències col·laboradores a tot el món i està disponible en línia poc després de ser rebut i, en forma totalment revisada i homogeneïtzada, uns 24 mesos després.
El butlletí inclou, a més del registre de la sismicitat global, altres informacions d’interès per als seus lectors. Des de fa quatre anys que s’inclouen articles on es descriuen amb detall els procediments rutinaris utilitzats per les diferents xarxes sísmiques que operen arreu del món. El quart article d’aquesta sèrie, només precedit pels dedicats a Japó, Canadà i Brasil, descriu el funcionament de la Xarxa Sísmica de Catalunya.
Hem pensat que fora bo compartir aquesta informació amb els lectors de la RCG. A l’ISC també va semblar una molt bona idea i hem d’agrair-li que posés totes les facilitats per reproduir íntegrament l’article que trobareu tot seguit i que va publicar-se al Summary of the Bulletin of the International Seismological Centre, vol 50 (1-6), 72-94.
1.1 The Catalan Seismic Network
The Catalan Seismic Network (ICGC, 2000) monitors the seismicity of Catalonia and nearby regions, where potentially damaging earthquakes for the region may occur. Catalonia is located in the NE of the Iberian Peninsula. Thus, we are dealing with a small network covering a small territory (the official surface of the region is around 32 000 km2). The seismic network is, at present, a unit of the Institut Cartogràfic i Geològic de Catalunya (ICGC). The ICGC (http://www.icgc.cat) is a new institute, created in 2014 following a merge of several organizations. Its present scope covers the fields of geodesy, cartography, geology, geophysics and the spatial data infrastructure in Catalonia. Among other duties, the ICGC manages the geodetic, seismic and avalanche monitoring networks covering the region. On the field of seismology, it is in charge of developing and maintaining the seismic network and studying and evaluating the regional seismic risk.
1.1.1 Seismicity of Catalonia
The seismicity of Catalonia is moderate. Just two damaging earthquakes occurred in the 20th century (intensities VIII and VII); but it is known from macroseismic records that destructive earthquakes occurred in the past, mainly in the Middle Ages, with intensities IX and even X (European Macroseismic Scale EMS-98) (Olivera et al., 2006).
Geologically, Iberia is a microplate with a complex evolution (Dewey et al., 1989; Roest and Srivastava, 1991). The present structural framework of the NE of the Iberian Peninsula is situated within the context of Mediterranean continental collision on the convergence of African and European tectonic plates (Goula et al., 1999; Olivera et al., 2003). Corresponding to that situation, the regional seismicity is diffuse, concentrating mainly along the Pyrenees and the Mediterranean coast (both inland and offshore). Figure 1.1 shows the located instrumental seismicity for the period 1984-2013 and the main historical events obtained through macroseismic records (Susagna and Goula, 1999).
In 2013, an episode of induced seismicity, with many felt events, known as CASTOR crisis (see small square in Figure 1.1) and named after an old oil field currently furnished as a gas reservoir, occurred to the South of our region of interest (ICGC, 2013; Cesca et al., 2014).
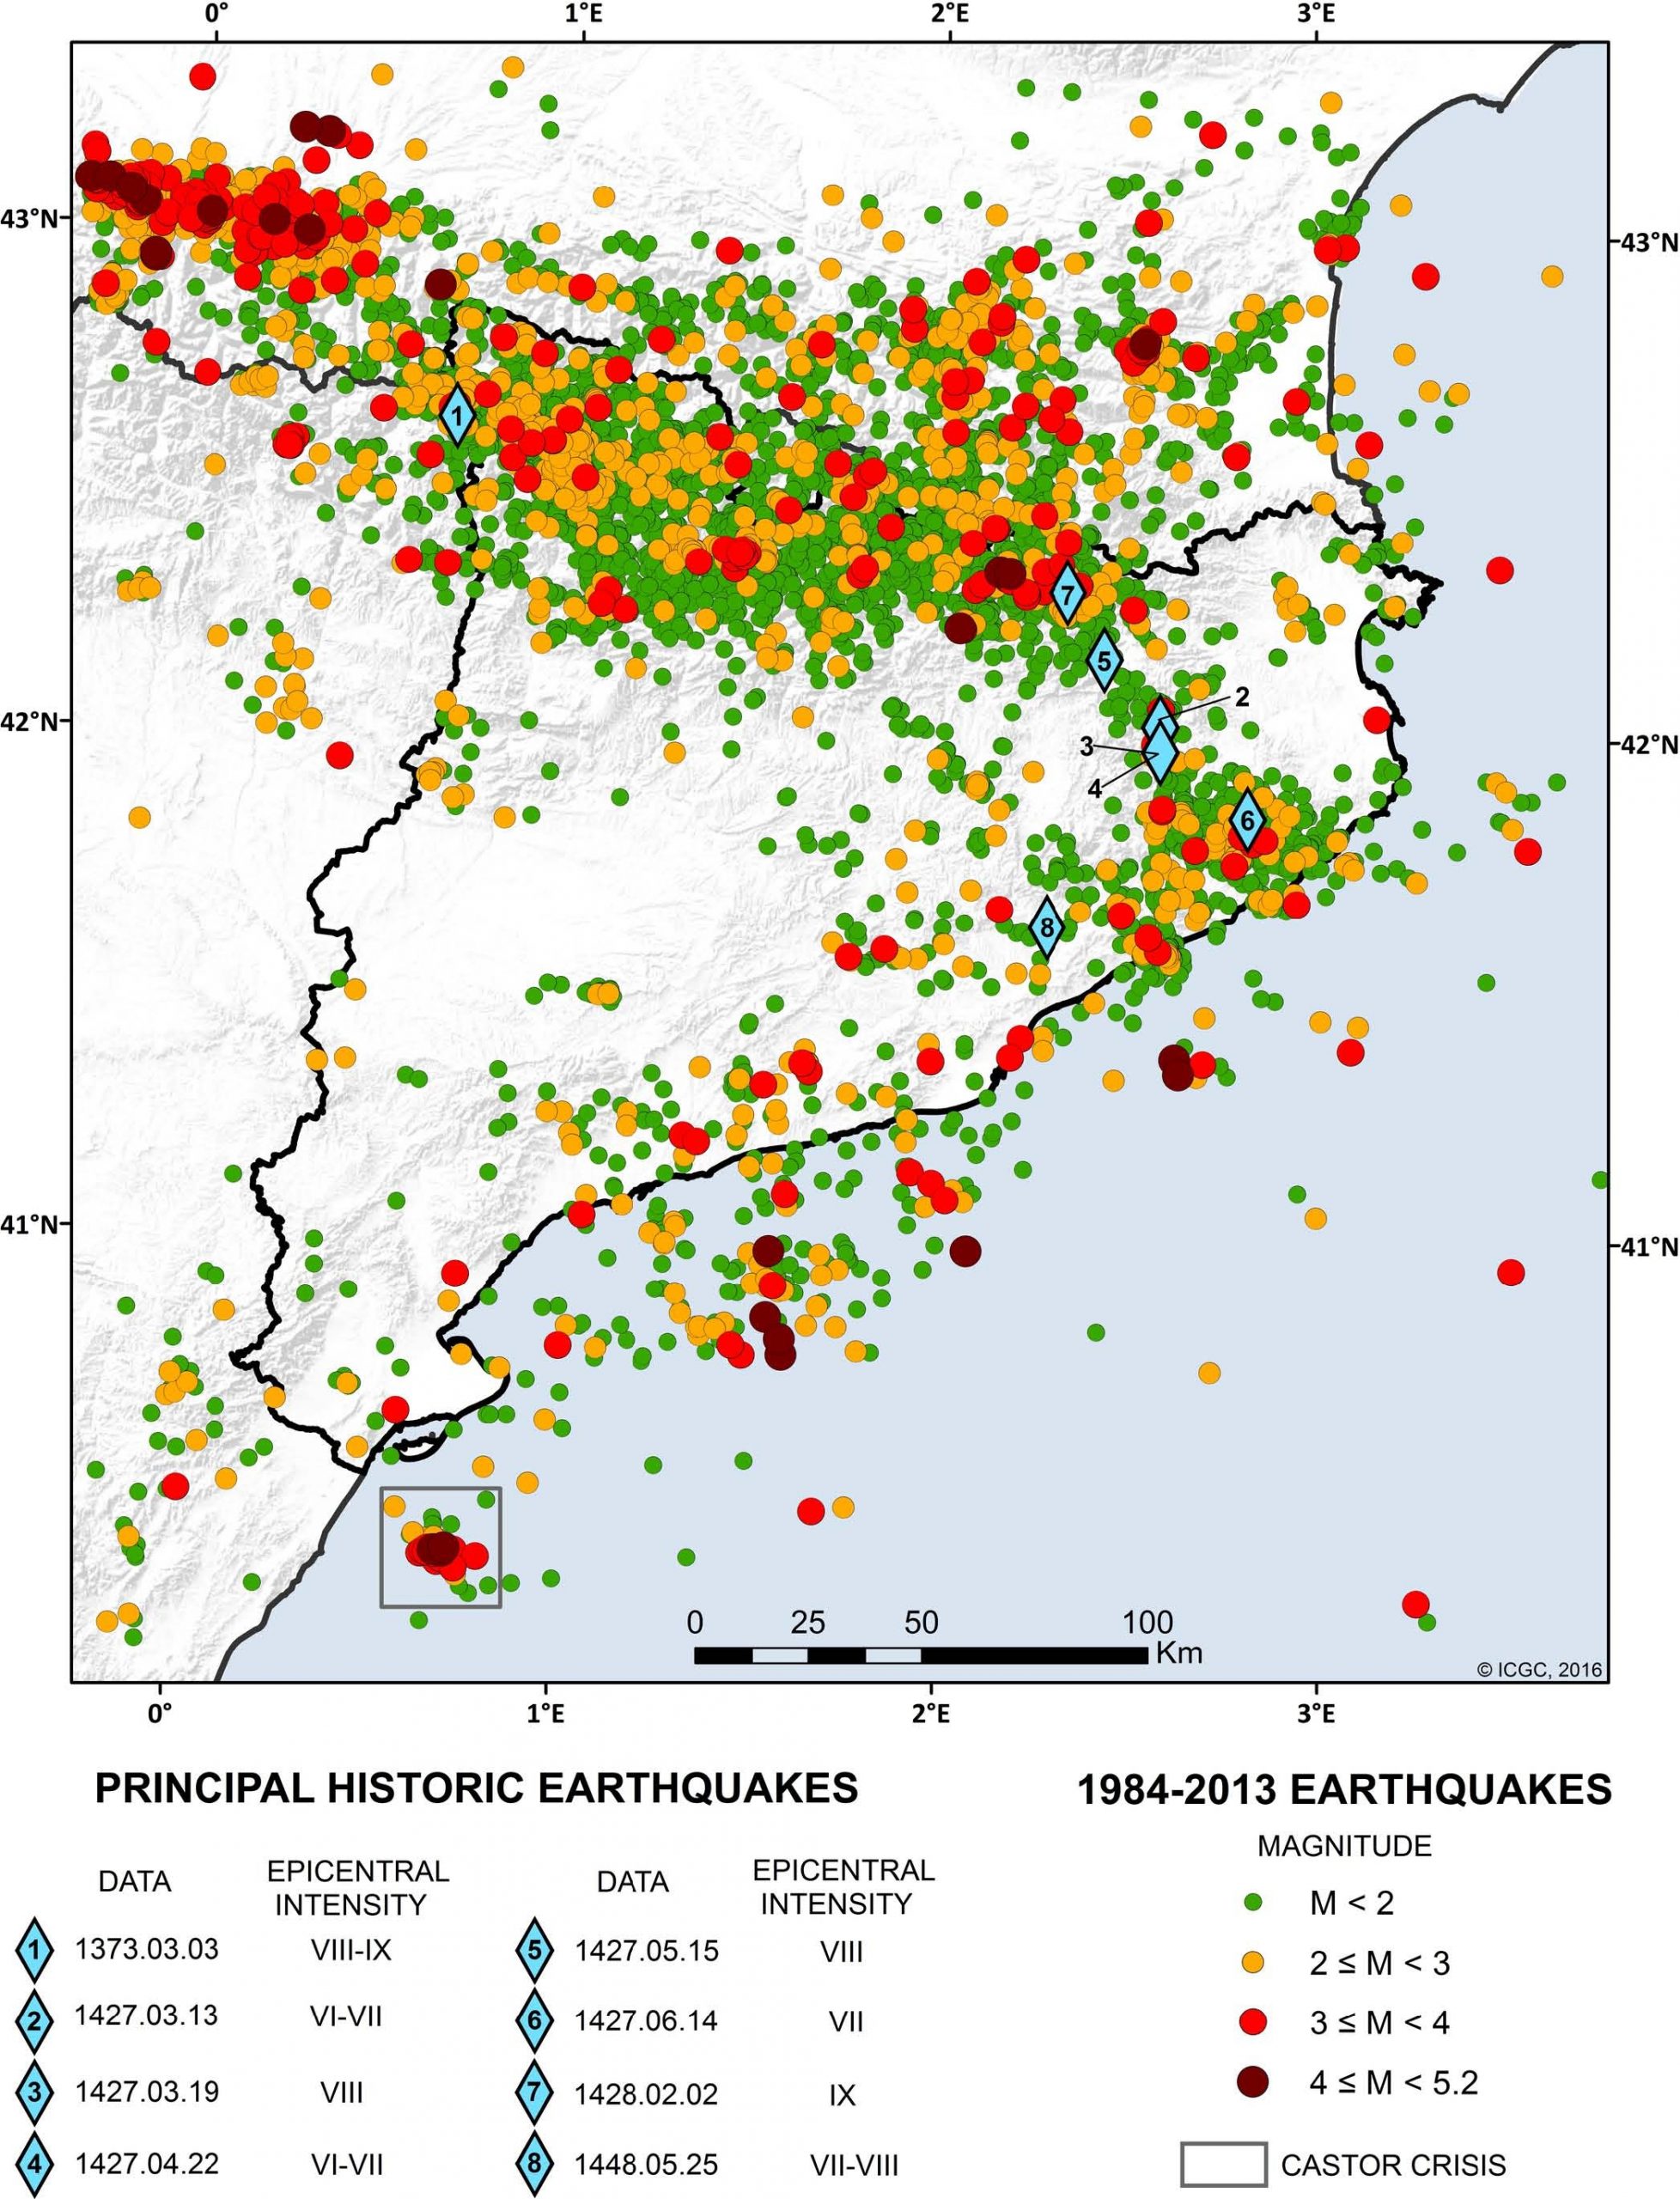
Figure 1.1. Instrumentally recorded seismicity for the period 1984-2013 (dots) and the main historical events (diamonds). The small square in the SW part is the place of the CASTOR crisis induced seismicity episode and it accumulates hundreds of events.
Figure 1.2 shows the Gutenberg-Richter relation for the whole region for the period 1984-2013 and Table 1.1, the approximate recurrence time for different magnitude earthquakes for the whole catalogue, including both instrumental and historical data.
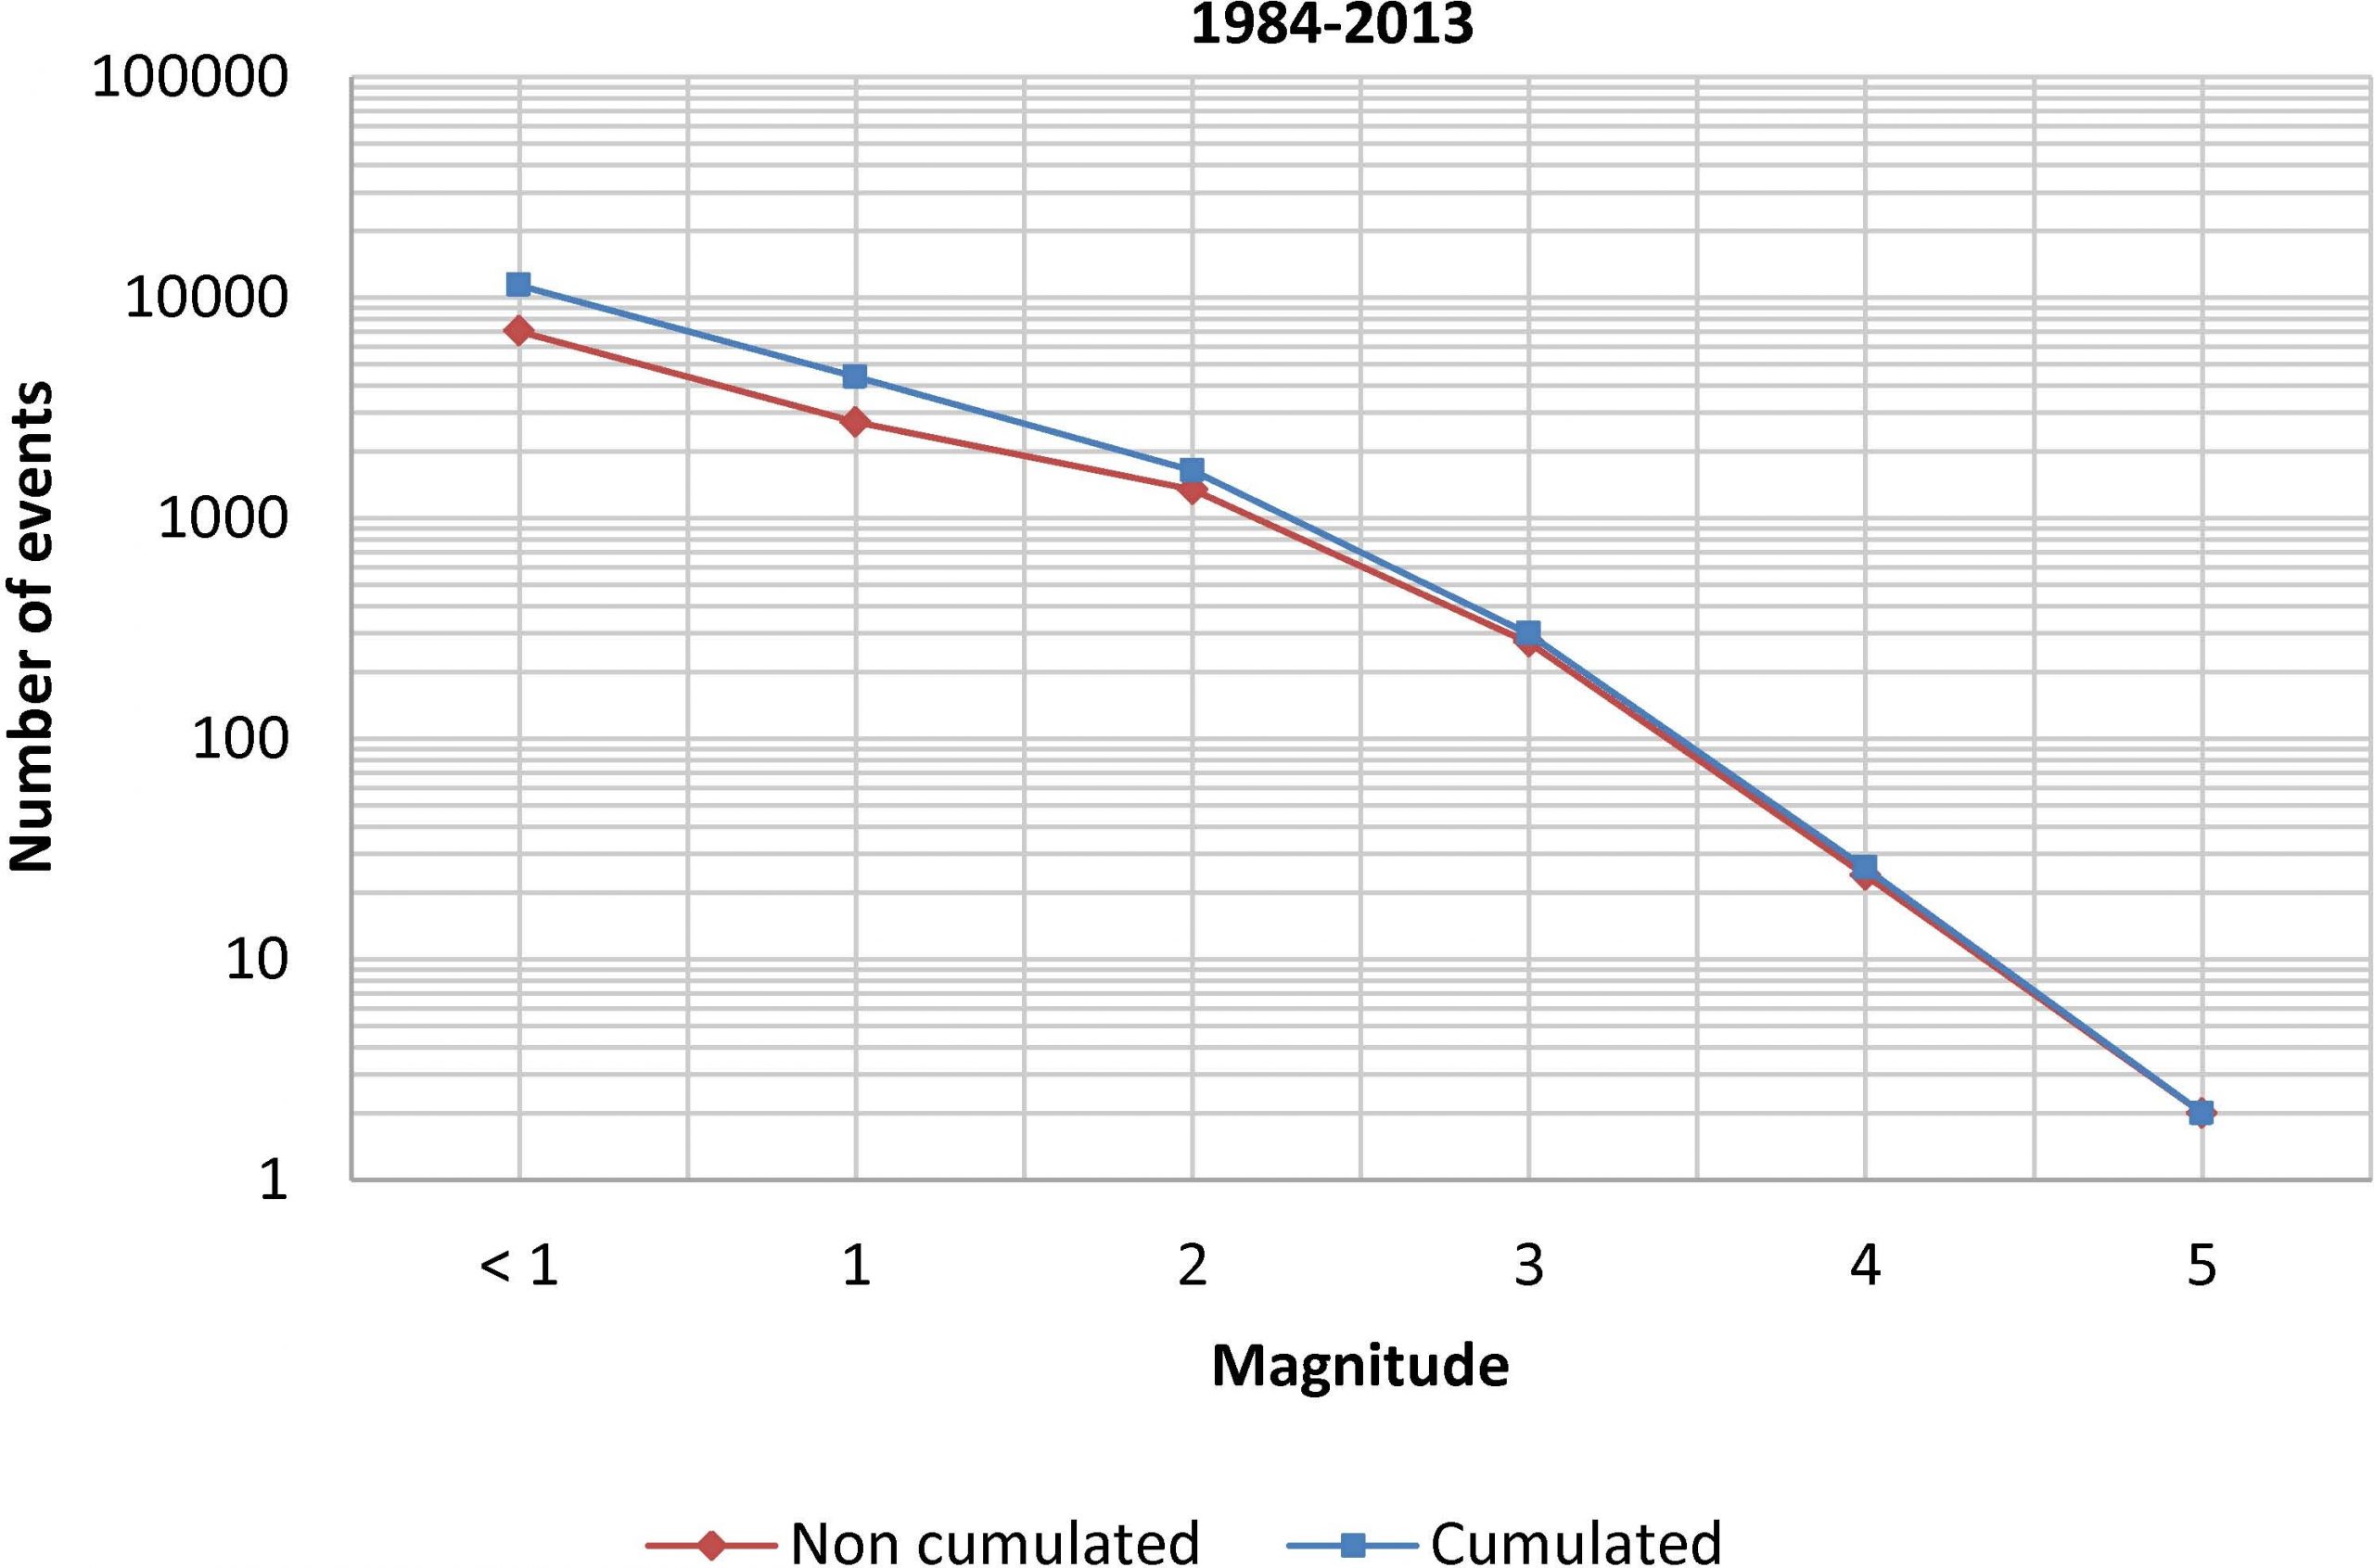
Figure 1.2. Gutenberg-Richter relation for the seismic events that occurred in Catalonia for the period 984-2013.
| Magnitude, M |
Recurrence period, T (years) |
| 3.0 | 0.2 |
| 4.0 | 2.5 |
| 4.5 | 8 |
| 5.0 | 30 |
| 6.0 | 500-500 |
Table 1.1. Approximate recurrence time for different magnitude earthquakes for the whole catalogue, including both instrumental and historical data.
1.1.2 History of Seismic Recording in Catalonia
Instrumental seismic recording in Catalonia started early in the 20th Century. In fact, plans for the use of seismoscopes in Barcelona date back to 1884 (Susagna and Batlló, 2008); but the first known seismic station (EBR) started in 1905 at Ebre Observatory, founded by the Jesuits near Tortosa, in the S of Catalonia. In 1906, the Academy of Sciences of Barcelona installed a second seismic station, still active, at the Fabra observatory (FBR), near Barcelona. Small observatories followed soon in Olot (1907) and Girona (1909), but they lasted only a few years and just some scarce data have been preserved (Batlló, 2003). It was necessary to wait until 1977, when a new station was set up in Susqueda Dam, for monitoring possible induced seismicity.
All these stations were the result of private initiatives and had reduced state support. Thus, the need for an improved seismic network was soon recognized when a Geological Survey was created in 1982 by the regional government.
The first stations of the new network were installed in 1985. The first instruments were vertical L4-C seismometers with drum analogue recording on thermic paper. In 1991 digital records (for triggered events) became general. The collaboration with the Observatoire Midi-Pyrénées (OMP) allowed setting up a common seismic network along the Pyrenees and the publication of a unified seismic bulletin for the region began.
Other stations not belonging to ICGC were also deployed in the region. Among them, and worth to note, in the late eighties, a few stations from the Spanish seismic network were deployed. Also, the Institut d’Estudis Catalans (IEC), an academic institution, installed the first broad-band station in Catalonia (CADI) in 1995.
1.1.3 Present Network Status
Since 1985, when the Geophysics and Seismology section of the Catalan Geological Survey installed the first permanent seismic station, the Catalan Seismic Network operated by ICGC has considerably evolved.
Currently the Catalan Seismic Network consists of 17 broadband seismic stations and 19 accelerometers installed throughout Catalonia and Andorra (Figure 1.3). Stations installed in Andorra are jointly operated by ICGC and Institut d’Estudis Andorrans (IEA).
i) Broadband stations
In 1999 the first 3 broadband stations (CFON, CLLI and CAVN) started operating and, since then, 14 other stations have been installed (Figure 1.3).
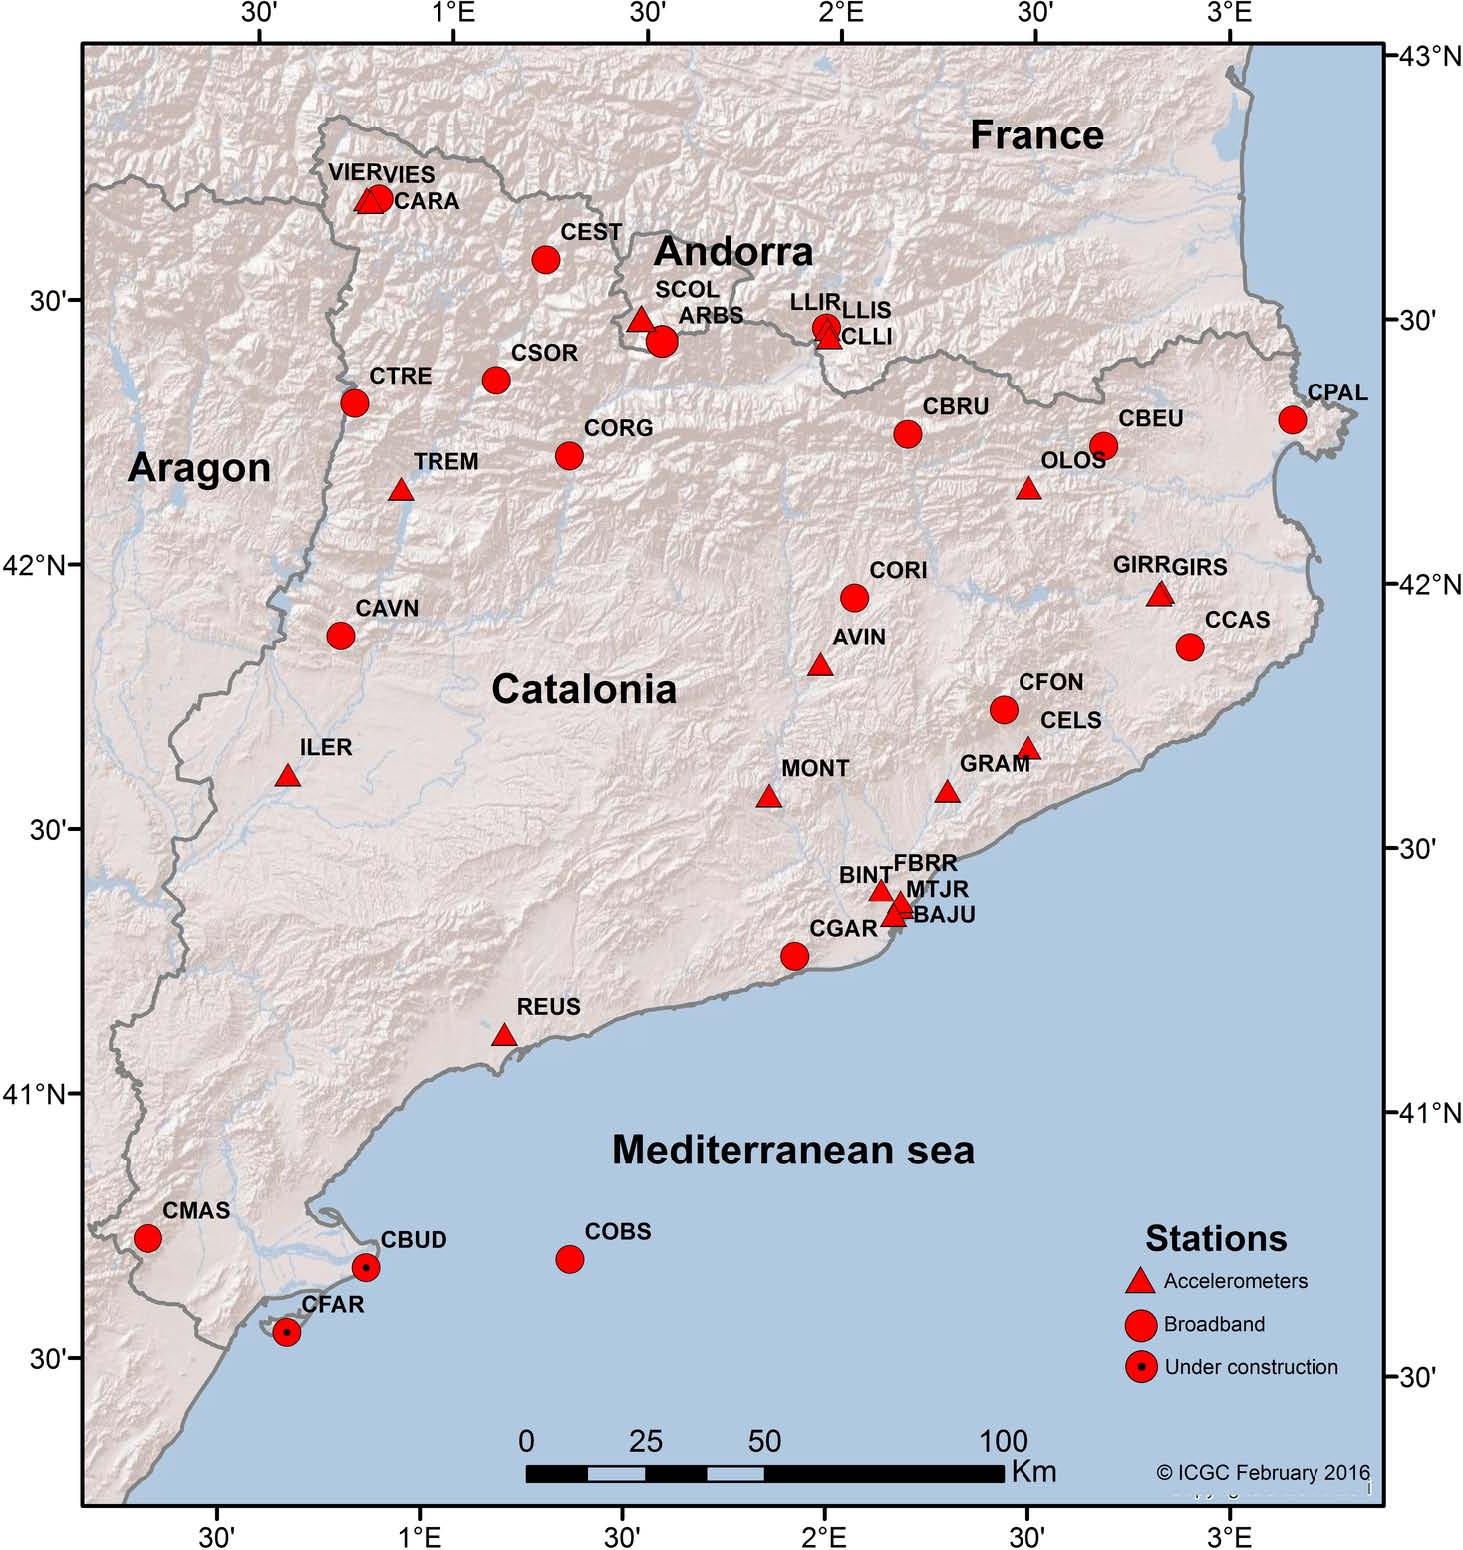
Figure 1.3. Distribution of broadband and accelerometric stations operated by ICGC. Stations SCOL and ARBS are jointly operated by ICGC and IEA.
All these stations are equipped with a broadband triaxial seismometer (STS-2, STS-2.5 or CMG3T), a 24 bits Lynx or Trident digitizers (100 sps) and a VSAT communication system transmitting continuous real-time data to ICGC headquarters in Barcelona. At those sites where the bedrock is exposed or found at a depth less than 4 meters, surface seismometers are installed at the bottom of a 2m x 2m pit with an adequate thermal and electromagnetic isolation; otherwise borehole type sensors are installed except for the Ocean-Bottom Seismometer station COBS. Images and details of the stations can be found in the website (http://www.icgc.cat/terratremols).
COBS station has been in operation since August 2005 (Frontera et al., 2010). It was the first permanent Ocean-Bottom Seismometer (OBS) installed in Spain. The OBS is installed inside the security perimeter of the Casablanca oil platform, which is located 40 km offshore Tarragona. The sensor is submerged at about 400 m to the SW of the oil platform at about 150 m in depth. Data are digitized on-site and are transmitted through a submarine cable to the platform, where they are recorded and sent to ICGC Data Center in real-time, via a VSAT platform.
Some of the recording sites are also used by the geodetic network. Thus, 6 seismic stations (CGAR, CCAS, CBEU, CLLI, CSOR and CAVN) are also equipped with a GNSS (Global Navigation Satellite System) antenna and receiver, and are integrated into the ICGC CORS (Continuous Operating Reference Station) network providing valuable data for plate tectonics monitoring among many other services and applications.
CFAR and CBUD are 2 new planned broadband stations currently under construction. It is scheduled that they will be operational before the end of April 2016.
ii) Accelerometers
Since 1995 ICGC, in collaboration with Instituto Geográfico Nacional (IGN), started the deployment of accelerometric stations throughout Catalonia. Currently the network comprises 19 accelerometric stations and it is still moving on. Different criteria have been considered for site selection: areas affected by historical damaging earthquakes, moderate seismic activity but densely populated places or where hazardous industries are established, and sites with different soil types to study amplification effects.
These stations consist of a self-contained 1g force balance triaxial accelerometer and a 24 bit data recorder connected to a redundant power supply system. Data are locally stored at 200 sps and at the same time streamed continuously in real-time to ICGC datacenter through Internet.
iii) Data Sharing
Waveform data from ICGC seismic stations are shared in real-time with other institutions as well as at ICGC data centre currently we are receiving real-time data from more than 30 foreign stations of various operators: Institut d’Estudis Catalans (IEC), Observatori de l’Ebre (OE), Bureau de Recherches Géologiques et Minières (BRGM), Observatoire Midi-Pyrénées (OMP) and IGN (Instituto Geográfico Nacional). All these data are used together for the routine analysis presented in next sections.
1.1.4 Data Processing
The data streams arriving at the central recording site (CRDS), at the ICGC offices in Barcelona, are stored and processed in different ways. Some procedures are fully automatized (DAS, Escenaris, ShakeMap) and others require the analyst intervention. They are described in the following sections.
At present, we just process data from local earthquakes (those whose epicentre is located in the area between 40.17o N and 43.33o N in latitude and between 0.33o W and 4.00o E in longitude). Ordinary manual processing is performed by analysts during normal office hours. Nevertheless, a seismologist is always on duty on a weekly basis, to manage a possible earthquake occurrence situation. This seismologist is in charge of checking the quality and correctness of the automatic process outputs and maintaining a proper contact and informing civil protection authorities. In case of small events during out of office hours, it is usual and easy to manage the situation from outside the ICGC office as the system is accessible via internet connection. In case of widely felt events even if not damaging, the situation requires the presence of the on-duty seismologist at the ICGC headquarters.
In fact, as the number of people involved in the managing of the network is reduced and we cannot guarantee a 24-hour, full year, office service, the whole operation system has been highly automatized. When an earthquake occurs the first information reaching civil protection is generated automatically. Secondly, the on duty seismologist intervenes. Another specific characteristic of the network, as it focuses on the aspects related to seismic risk and to optimize the collaboration with emergency systems, is the integration of ordinary BB records with accelerometric records in the manual processing system. This allows obtaining not only hypocentres, magnitudes and other earthquake parameters; but also other outputs such as PGA (peak ground acceleration), PGV (peak ground velocity), elastic response spectra, etc. specifically related with engineering applications (see Sections 1.1.4 and 1.1.4).
Automated Process (DAS)
The present Seismic Automatic Determination (DAS) system, installed at ICGC in 2005 (Romeu et al., 2006), is based on Earthworm tools developed by the USGS and adapted to the local needs and conditions of the Catalan Seismic Network. The detection picking module pick_ew develops the Allen algorithm (Allen 1978, 1982), and we specifically configured it to avoid the detection of regional and teleseismic events. The module binder_ew declares the events taking into account the coherent pickings and sends them into the Hypocenter locator (Lienert and Havskov, 1995). The hypocentral parameters obtained initiate other calculations: local magnitude (with localmag module), strong-motion parameters (gmew) and damage scenarios (with Escenaris module developed in ICGC).
Figure 1.4 shows the DAS performance results for the last stable period of configuration (2011-2015). While quarry blasts cause most of the event detections, local earthquakes represent 40% of the total events automatically detected by DAS; detections are minimal for noise and teleseisms, but still relevant for regional earthquakes coming from regions surrounding ICGC local area (Figure 1.4a). 91% of local earthquakes present in ICGC catalogue with magnitudes equal or greater than 2.0 are detected by DAS (Figure 1.4b). Above that magnitude, lost detections are due to aftershocks or earthquakes occurring in the extreme south of ICGC local area, not yet comprehensively covered (as explained in Section 1.1.3, two broadband stations are planned by the end of April 2016 to cover this area). For 75% of the epicentres located, the distance differences between DAS epicentres and its corresponding revised epicentres from ICGC catalogue are less than 10 km (Figure 1.4c). Even if magnitude error shows a positive bias of 0.24, 78% of local earthquakes detected by DAS have a magnitude error less than 0.5 (Figure 1.4d).
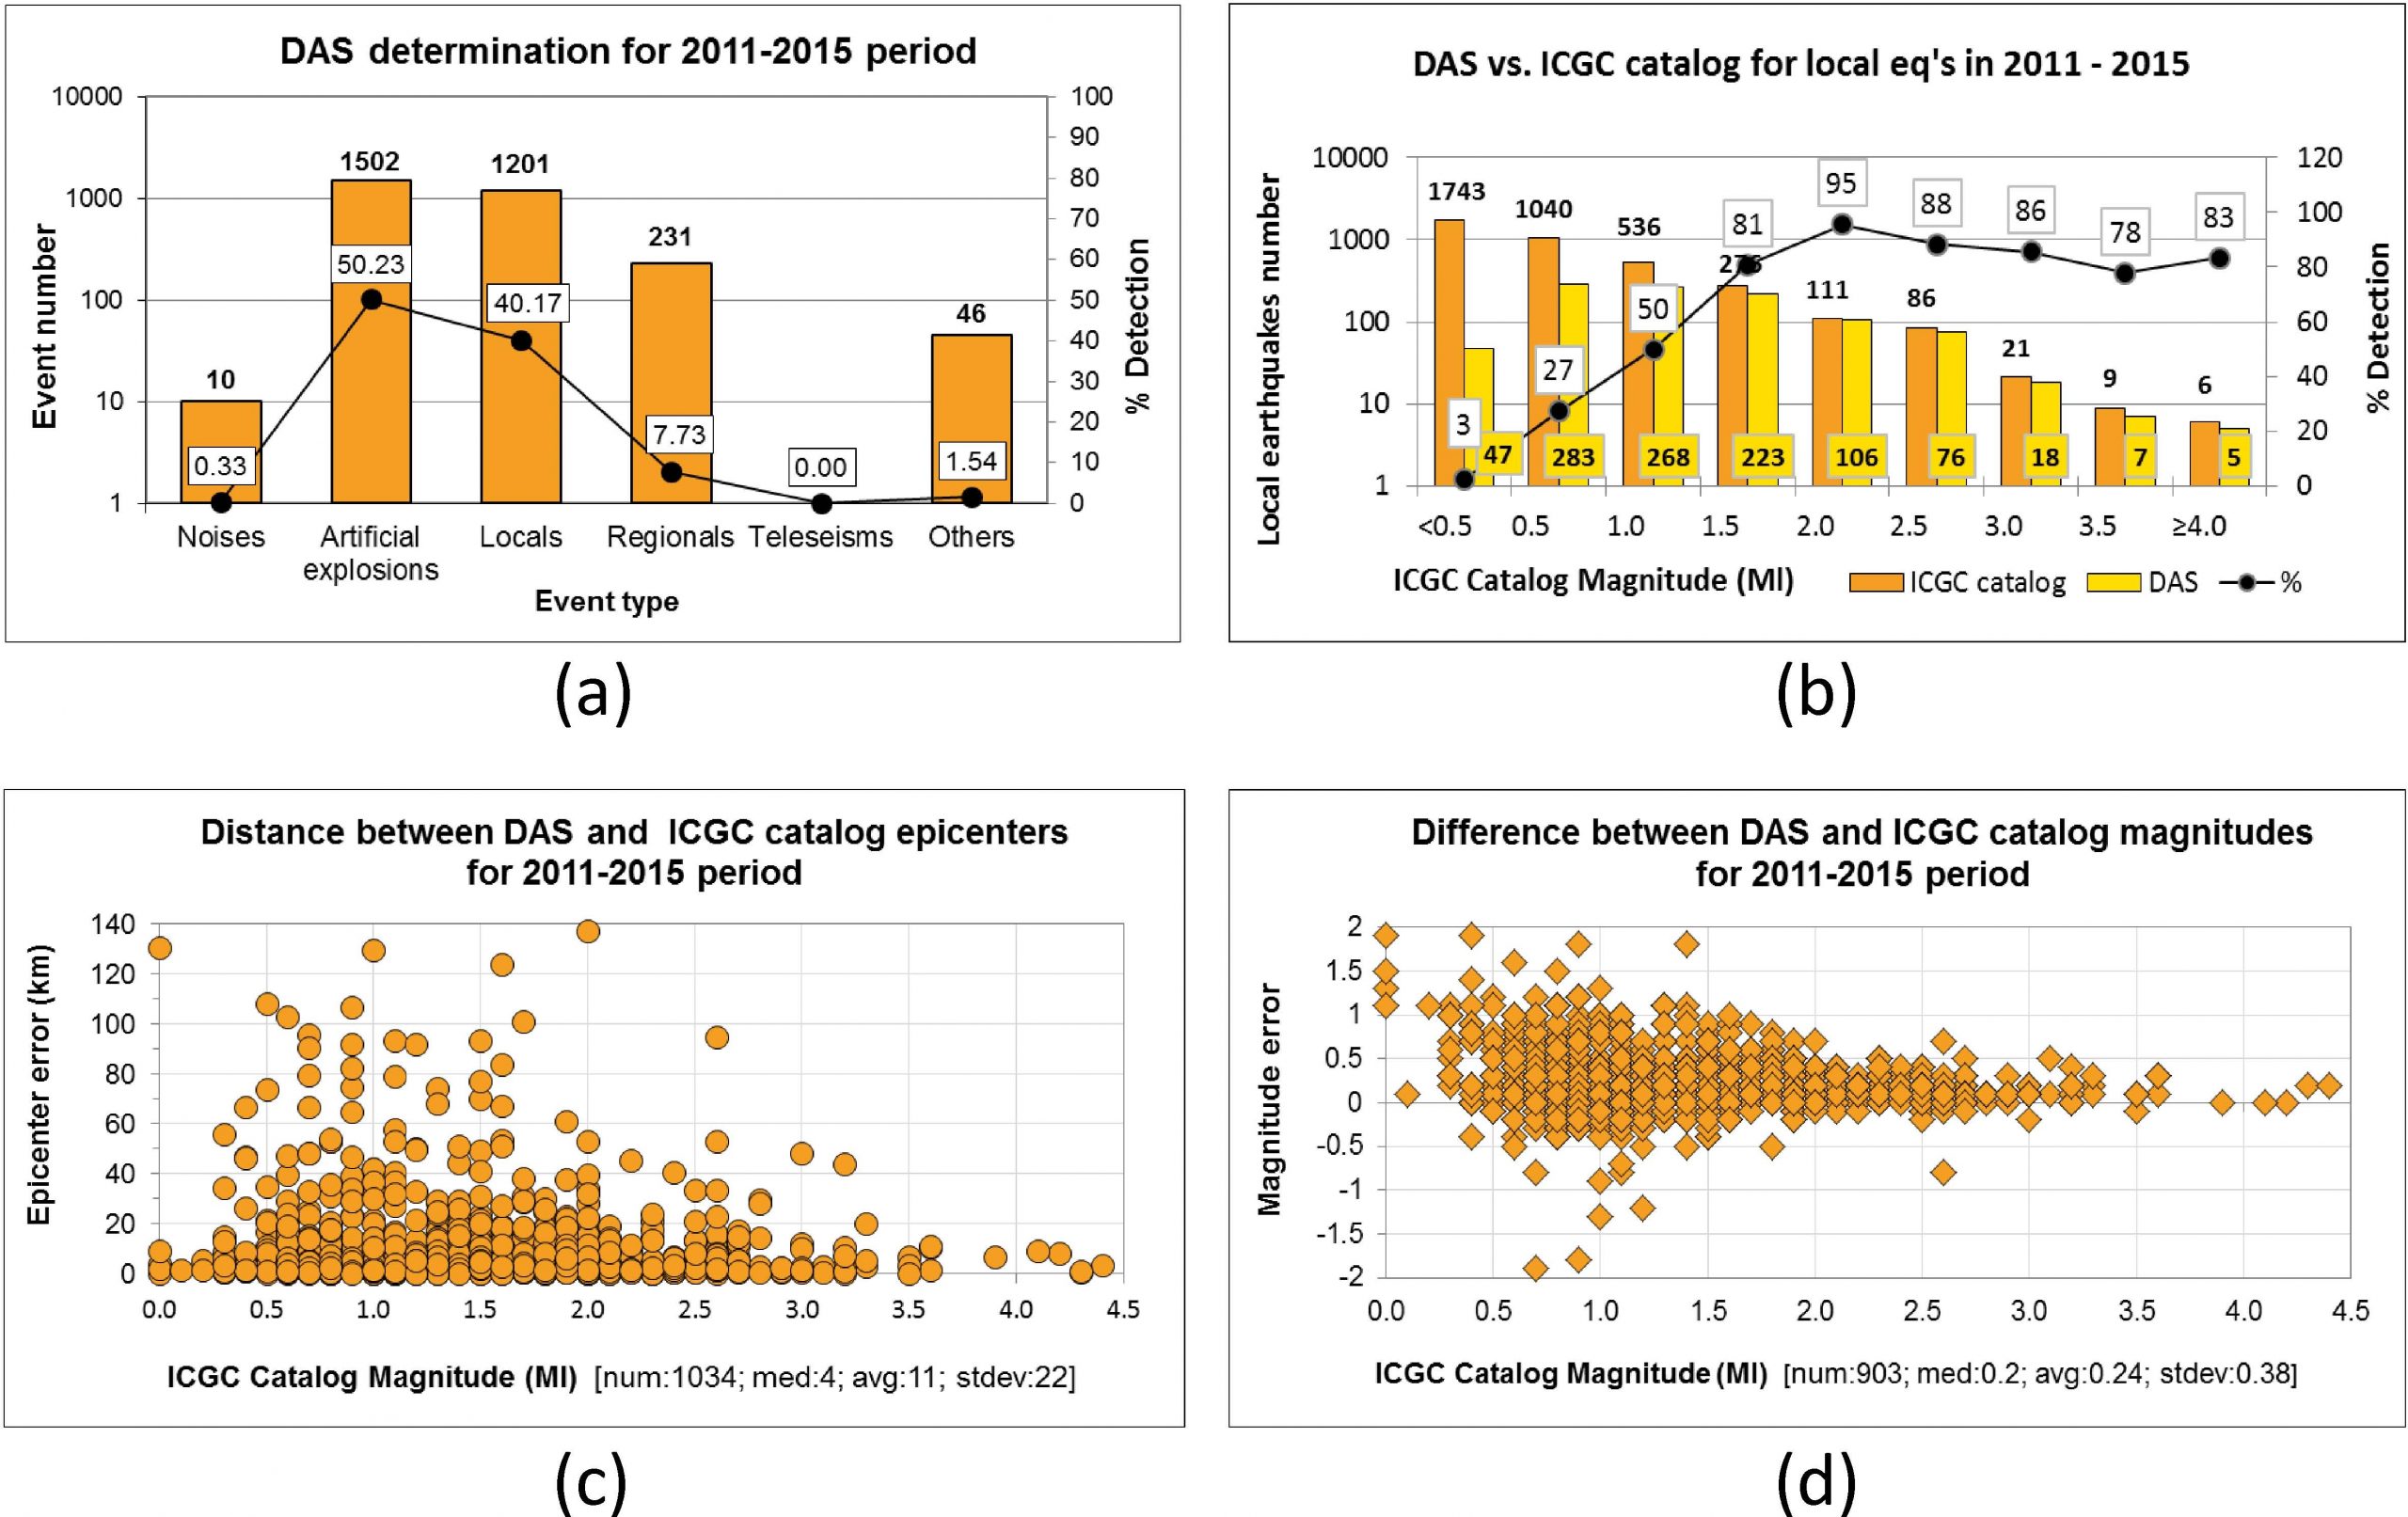
Figure 1.4. DAS performance results for 2011 – 2015 period. (a) DAS determination classified by event type. (b) Comparison between local earthquakes detected by DAS and ICGC catalogue. (c) Location error of local earthquakes detected by DAS. (d) Magnitude error of local earthquakes detected by DAS.
All the information related to the located events, along with their waveforms is stored in an Oracle database. The content of the database is available for queries through Posidó, the manual processing software at ICGC, and through the web application WebEvents which, together with WebInfra (access to the network infrastructure) and WebContinu (access to dataset of continuous data), comprises the internal web service Sisweb (Figure 1.5).
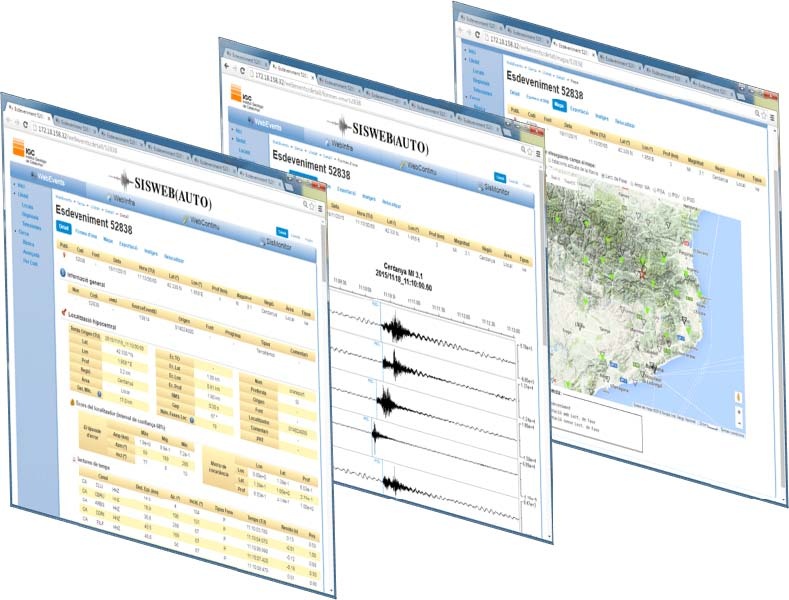
Figure 1.5. Sisweb is a web service consisting of three web applications: WebEvents, WebInfra and Web-Continu. The figure shows some WebEvent web pages: left, the event details with the hypocentre location, magnitudes and strong-motion values of an event detected by DAS; middle, the event waveforms with the automatic P-wave readings; right, a map locating the event epicentre and the stations with associated picking. This information is immediately available to the on duty seismologist after any DAS event detection.
Scenarios
In the case of an earthquake detected by the DAS to be strong enough to be capable of causing damage, an automatic seismic damage scenario is generated by the Escenaris software. This software estimates the seismic damage that can be expected in the municipalities affected by the detected earthquake. It incorporates a seismic vulnerability database with a built-in statistical distribution of vulnerability classes based on the EMS-98 scale, specifically developed for the Catalonia region (Roca et al., 2006) which depends only on information about the height and period of construction of the buildings. The associated damage probability matrices are defined based on damage observations from the 1980 Irpinia earthquake.
Losses are expressed in terms of both physical (uninhabitable buildings) and social impact (number of fatalities, injured and homeless) as well as in terms of the number of dwellings in each damage state. The output is automatically sent to civil protection and emergency system management. The Escenaris software is also integrated in a rapid response system operating over the eastern Pyrenees (Goula et al., 2008). Figure 1.6 shows an Escenaris estimation of the number of uninhabitable buildings that can be expected if an earthquake of M5.5 would occur in the Cerdanya region.
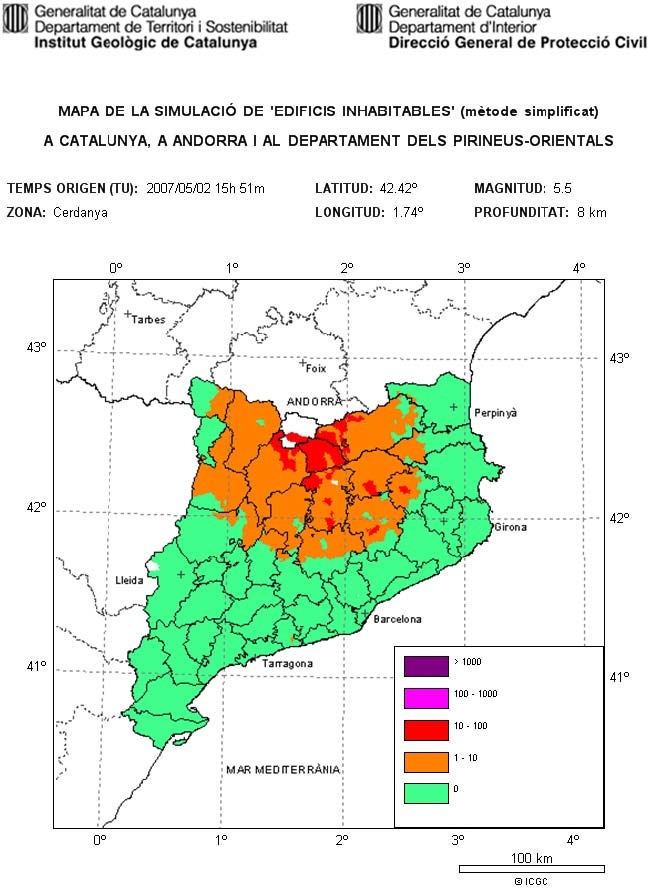
Figure 1.6. Example of the uninhabitable buildings automatic estimation using Escenaris.
ShakeMap
For earthquakes with a magnitude M ≥ 3.0 with epicentres within the transborder area of the Pyrenees a set of ground motion maps, or ShakeMaps (see Section 1.1.5, Figure 1.15), are automatically produced. The ShakeMap open code (Wald et al., 1999) available from the USGS was adapted with the collaboration of the IGN, BRGM, OMP and BCSF (Bureau Central Sismologique Français) inside the SISPyr project (SISPYR, 2013), financially supported by the POCTEFA program. To produce these ground motion maps in the Pyrenean region, specific systems and protocols have been developed and implemented for receiving, in real time, data from both seismic and accelerometric stations.
When an earthquake meets the above criteria, the ShakeMap software plots the maximum acceleration, maximum velocity and spectral acceleration for 0.3 s, 1 s and 3 s periods. Additionally, it combines ground motion parameters with macroseismic intensity data, which are automatically analysed and sent to several agencies. The system continues to integrate macroseismic data for several hours after the earthquake occurs. Ground amplification factors related to the type of ground surface and the different layers in depth are also considered. (Bertil et al., 2012).
Manual Processing (Location, Magnitude, Focal Mechanism)
All the events that have been automatically located in the local study area, as well as the possible events declared by a binder system are reviewed by an analyst in order to locate small seismological events and to identify and avoid publishing artificial events and noise. This analysis is made through the Posidó software (Figure 1.7), developed by the ICGC, which allows the picking of the phase arrival times for the hypocentral location, as well as the maximum amplitude measurement for the magnitude calculation. Posidó has also a signal processing module as well as a number of seismic engineering applications (see Section 1.1.4).
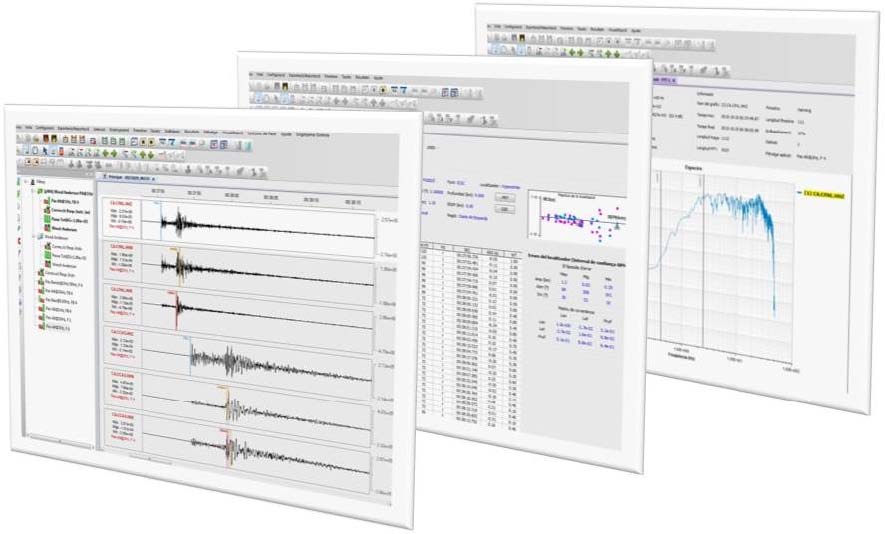
Figure 1.7. Posidó interface for hypocentral location, magnitude calculation and signal processing.
Epicentral locations are regularly calculated with Hypocenter (Lienert and Havskov, 1995), although Posidó allows also the hypocentral location using Hypoinverse (Klein, 1978, Klein 2014). A onedimension crustal velocity model adapted to the study region is used (Table 1.2). A relation VP =VS = 1.75 is assumed. As the greatest part of the local seismicity occurs in the Pyrenean region, the model is especially well adapted to this zone. Nevertheless, if a sharp increase of seismicity takes place in another region, where this model is not so well adapted (e.g., the Castor induced seismic events, occurred in 2013, in the South of the study region, with offshore epicentres), a better adapted model can be considered.
| VP (km/s) | Layer depth (km) |
| 5.5 | 0 |
| 5.6 | 1 |
| 6.1 | 4 |
| 6.4 | 11 |
| 8.0 | >34 |
Table 1.2. One-dimension crustal velocity model. P wave velocity (VP ) in km/s and its corresponding layer are shown.
As the area covered by the network is small, a local magnitude, Ml, is well fitted when investigating the size of the recorded earthquakes. It is calculated from the maximum peak-to-peak amplitude measured on the Wood-Anderson simulated waveform on each available horizontal channel. It is given by the median of the following measurements for each channel:
Ml = log10(AP2P / 2) – log10(A0); (1.1)
where AP2P is the peak-to-peak amplitude in mm and A0 is an approximation of the attenuation of seismic waves due to epicentral distance. At present, the attenuation defined by Richter (1935) for California is used.
For events with Ml ≥ 3.5, a focal mechanism is calculated using the method developed by Delouis (2014). The method is based on both the waveform inversion of near source seismic records and on a linear finitesource model. The primary source parameters that are determined are the moment magnitude (Mw) and the double-couple focal mechanism (strike, dip and rake). Source depth is also explored. For moderate to small earthquakes (Mw < 5.5, which is the case for most of the events in the Catalan region), single point source is assumed. A specific band-pass filter is automatically adapted for each individual component of the seismograms (north, east, vertical). The spectrum of the whole seismic signal is analysed to identify deviations from the expected linear trend of the positive slope at low frequency. The high-pass frequency is identified as the frequency from which the acceleration spectrum maintains a positive near-constant slope up to the plateau area near the corner frequency. The inversion is carried out in successive steps combining fast grid searches on the parameters. A confidence index is defined. The moment tensor is calculated via the webservice FMNEAR (FMNEAR webservice, Delouis, Gerakis, Deschamps, Geoazur/Observatoire de la Côte d’Azur, http://source.unice.fr:8080/FMNEAR_website/fmnear.html). An example is shown in Figure 1.8.
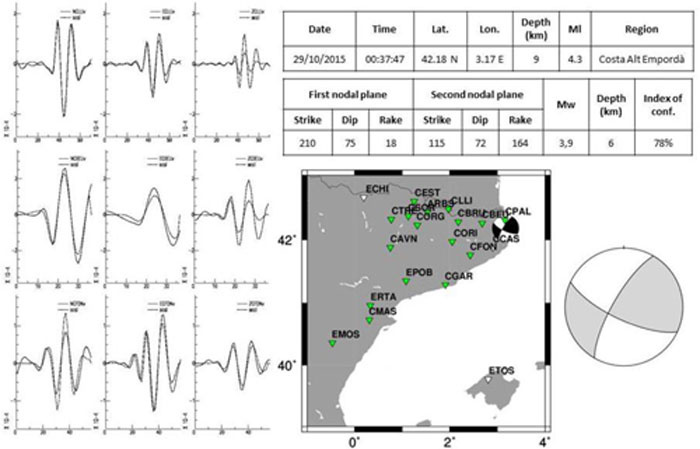
Figure 1.8. Example of the moment tensor calculation for the Ml 4.3 event occurred on October 29th, 2015, offshore north Catalan coast.
Accelerometer Data Processing
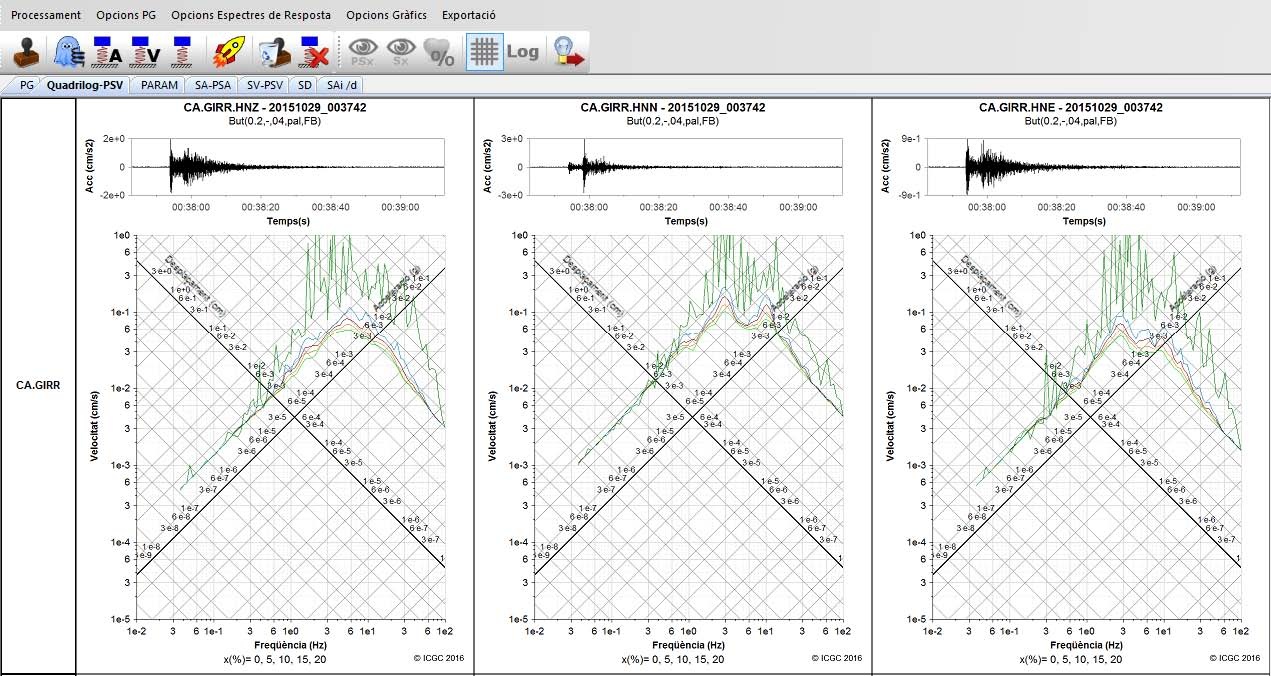
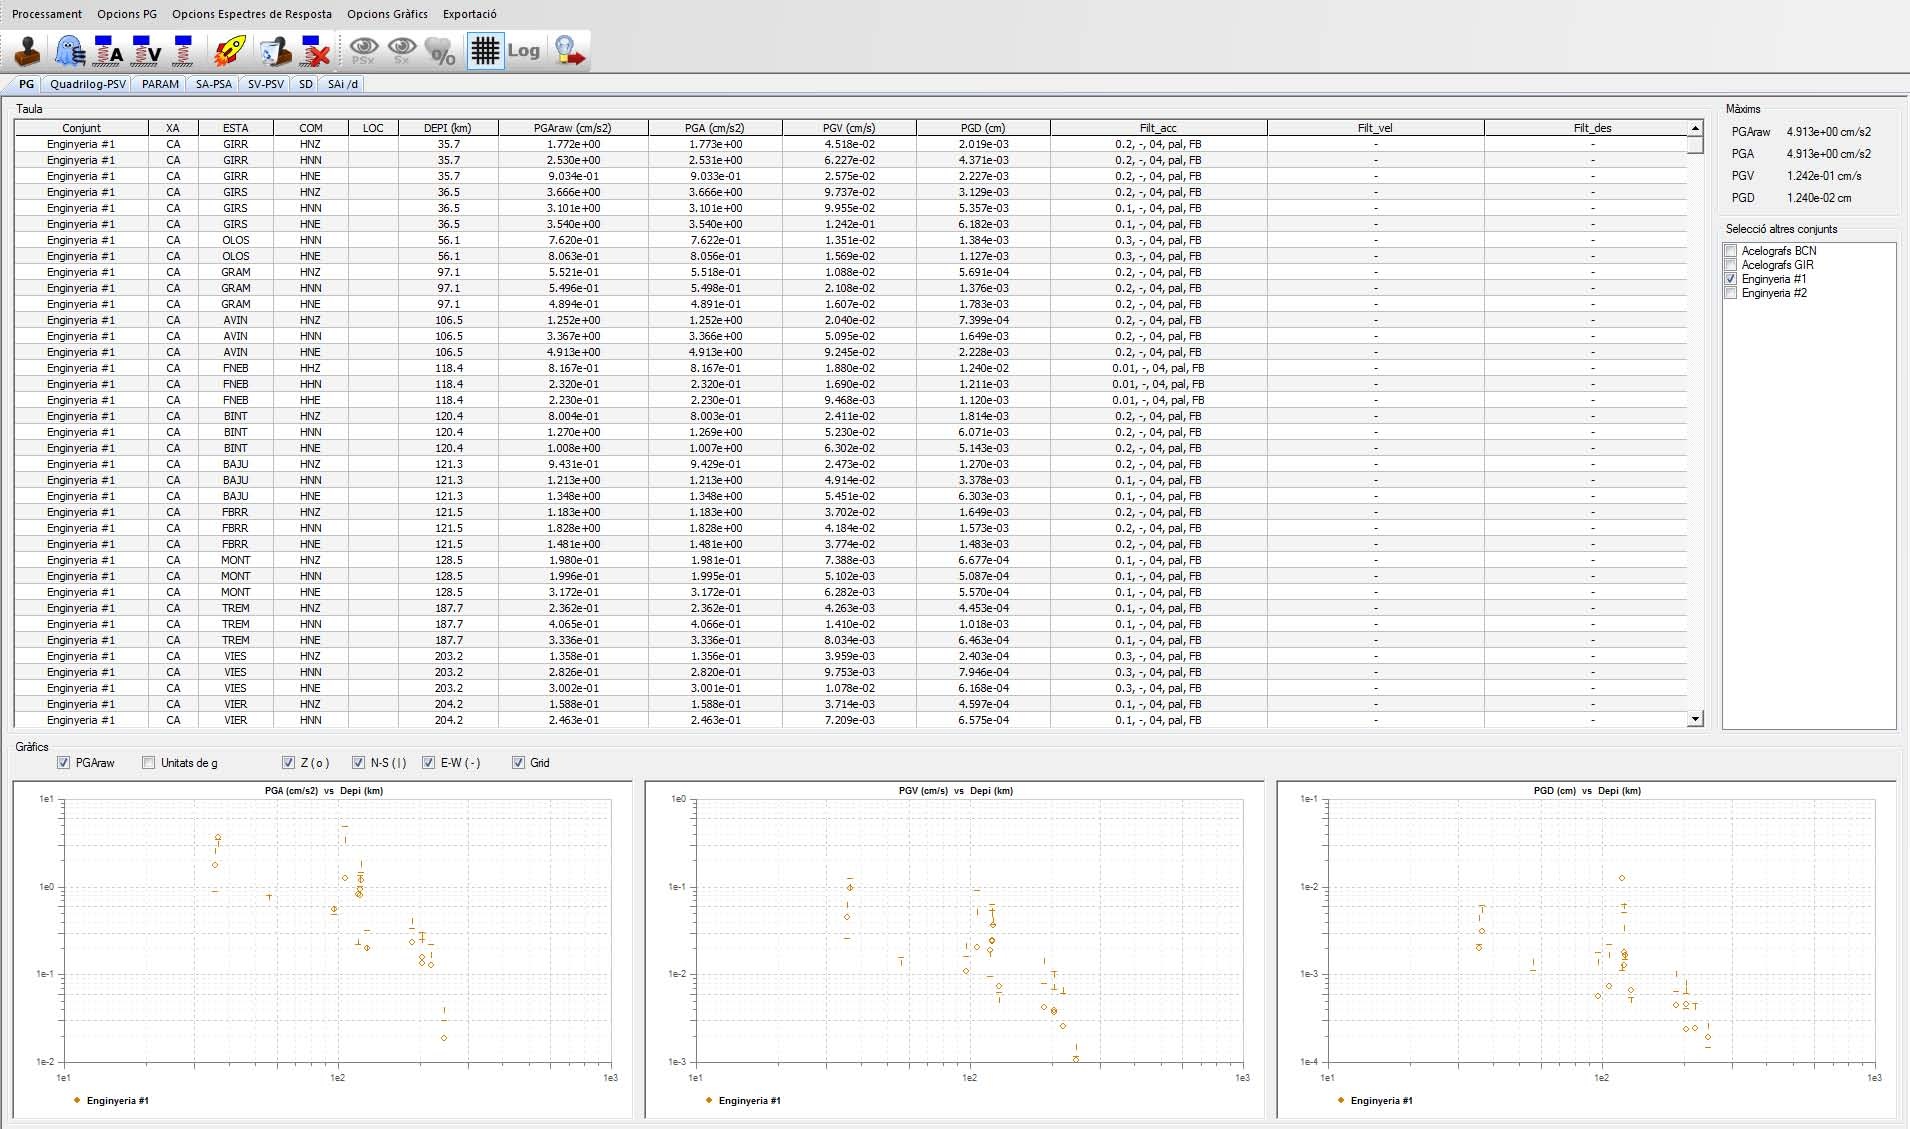
Accelerometer data are manually processed using the Neptú module (Figure 1.9) integrated in the Posidó software. This module allows performing a complete seismic engineering analysis of the accelerometric data that includes the automatic calculation of both raw and filtered peak ground acceleration (PGA), peak ground velocity (PGV) and peak ground displacement (PGD) values and the corresponding response spectra for each record from each station. It also allows the export of acceleration, velocity and displacement records and the results of the analysis both in digital and graphical format.
 |
 |
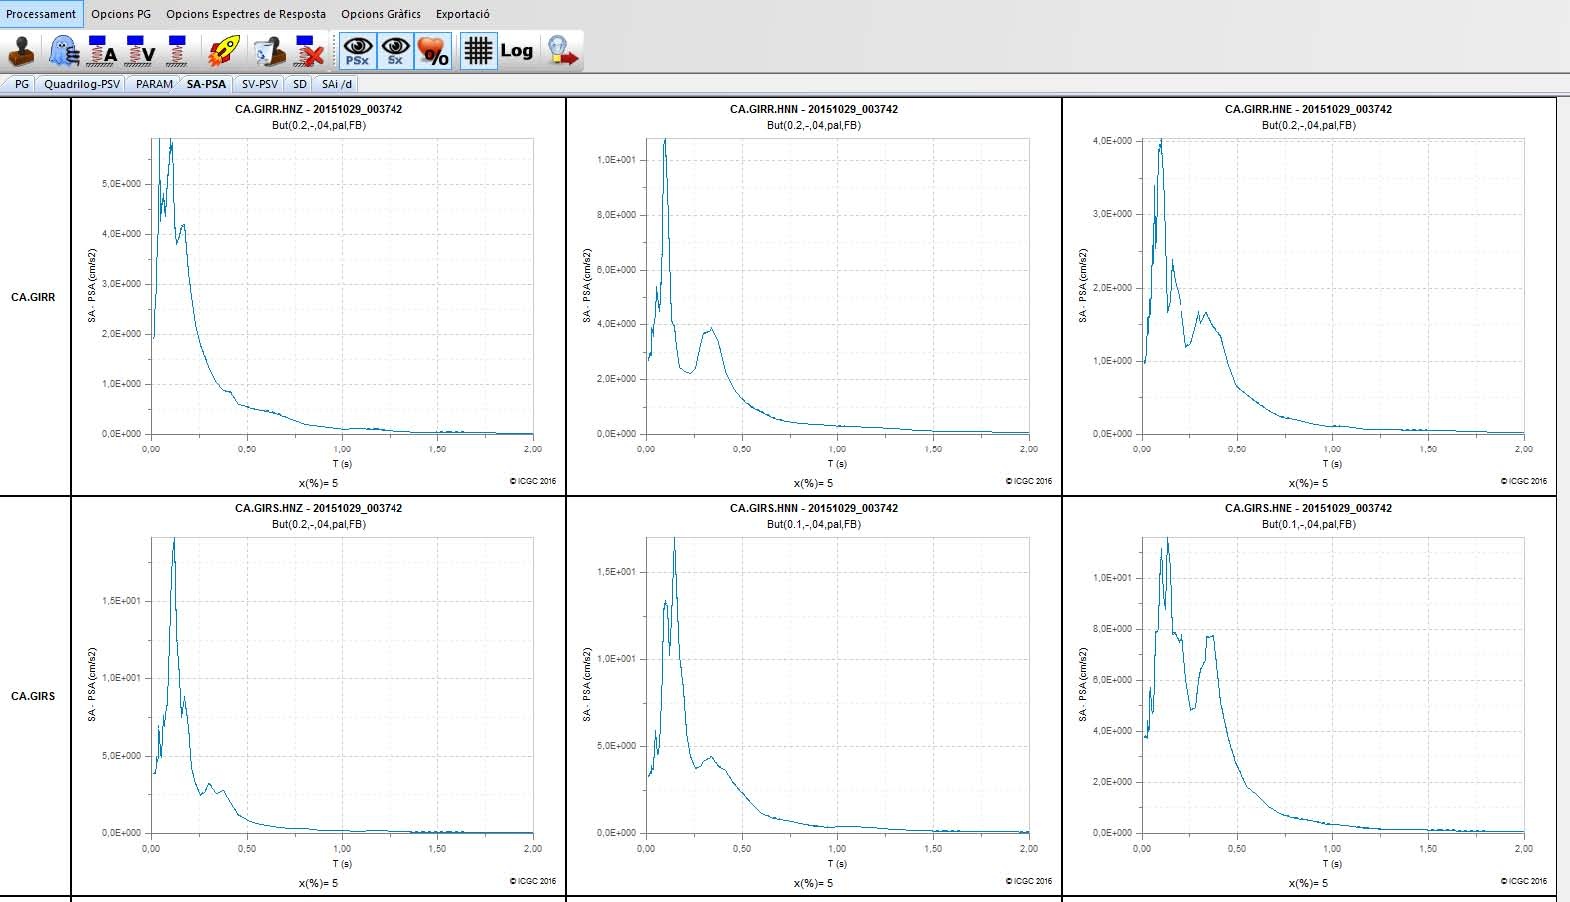 |
Figure 1.9. Examples of outputs of Neptú module for engineering applications for the October 29, 2015 M4.3 earthquake in the Roses Gulf: (a) PSV (Pseudo-spectral velocity) quadrilogs graphics for different damping values for the three components of the record from the Girona accelerometric station, (b) Table with ground motion parameters for all stations considered and attenuation graphics for peak ground acceleration and peak ground velocity, (c) pseudo acceleration response spectra.
1.1.5 Data Dissemination
Data and earthquake information generated through the different applications presented in the previous sections are disseminated in different ways. Civil protection, governmental offices, research community and general public are our main users. Thus, different products deserving different needs are necessary. As before, some of the products are produced automatically (thus, tightly related to the items described in Sections 1.1.4-1.1.4) and others are obtained by the seismologists after manual analysis.
Seismic Network Data Dissemination
Data dissemination is achieved mainly through the ICGC website (http://www.icgc.cat/terratremols). All the data recorded by the Catalan Seismic Network is open and freely distributed upon request.
After a manual revision and location, local earthquakes (as mentioned before, those occurred in the area 40.17o N – 43.33o N, 0.33o W – 4.00o E) are published daily. Figure 1.10 shows an example of the tables presented on the website. These tables show the basic data for the earthquakes detected during the chosen month and provide links to the location map, the waveforms and the GSE format files for each earthquake. Even when we are not analysing earthquakes located out of our area of interest, similar tables are available for the detected regional earthquakes and teleseisms including the basic data provided by other agencies and the waveforms of the events registered by the ICGC’s seismic network.
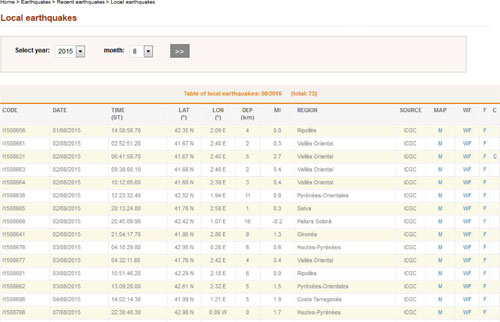
Figure 1.10. Table of local earthquakes for August 2015.
Seismological bulletins have been published annually since 1984. They are accessible on the website and contain a summary of all the information about earthquakes detected during the year. These bulletins act as the definitive catalogue as all earthquakes are revised and, if available, data from external agencies are integrated to enhance their hypocentral location.
Since 1996, acceleration records have also been available on the website. Epicentral distances and maximum peak ground acceleration values are listed for each acceleration record (Figure 1.11). Both, acceleration records and response spectra can be downloaded. By February 2016 a total of 1016 acceleration records had been published for a total of 246 earthquakes.
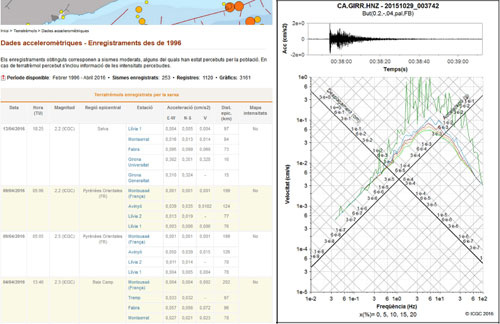
Figure 1.11. (Left) Table of acceleration records and (right) an example of accelerogram and elastic response spectrum at different damping values.
Seismic Live Data
The ICGC website also offers a seismic live data service for almost all its stations so users can view the waveforms in virtual real time and also from a given day. Both broadband and accelerometric stations are included and the broadband data are shown both high pass band filtered and in its raw form. It is one of the most visited pages of the whole website as it is useful to follow seismic crisis and to visualize the relative amplitudes and different arrival times for a given earthquake through the shown stations.
Figure 1.12 shows an example of the seismic live data service for the case of the M4.3 earthquake that occurred on October 29th, 2015 in the Roses Gulf. All day long waveforms are shown for 4 broadband stations filtered (left column) and in raw format (centre column). Also 3 accelerometric stations are shown (right column).
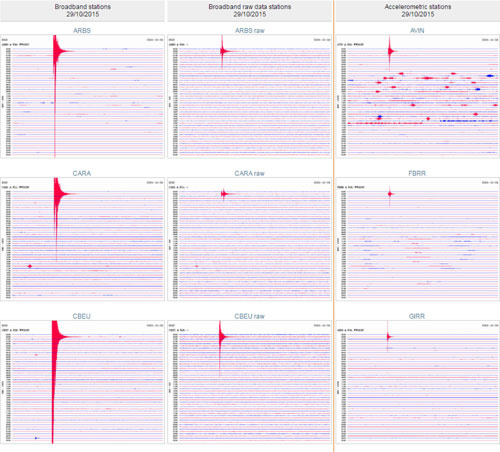
Figure 1.12. Example of the seismic live data service for the M4.3 earthquake in the Roses Gulf that occurred on October 29th, 2015. All day long waveforms are shown for 4 broadband stations (ARBS, CARA, CBEU, CFON): filtered (left column) and in raw format (centre column); also 3 accelerometric stations (FBRR, GIRR, GRAM) are shown (right column).
Fast Seismic Information for Felt Earthquakes
When an event detected by DAS system fulfils certain criteria: its epicentre is located inside the ICGC local area with magnitude equal or greater than 2.4 and it meets some quality parameters (minimum number of arrivals, channel magnitudes, RMS within a threshold. . . ), Teleavis (software developed at ICGC; Romeu et al., 2006) sends an automatic notification via SMS, email and FTP to 58 regional administration users within a few minutes after the earthquake occurs. This notification includes the hypocentral parameters, an automatically generated map showing the epicentre location and its strong motion values (PGA and PGV), as shown in Figure 1.13. It also automatically sends a GSE format file to contribute to the EMSC-CSEM (Euro-Mediterranean Seismological Centre) Real Time Seismicity Service (http://www.emsc-csem.org/Earthquake/).
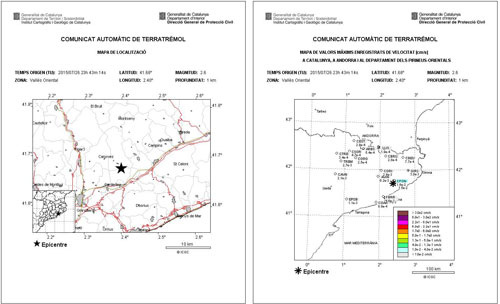
Figure 1.13. Example of Teleavis notification for 26/07/2015 event: location and PGV map.
In case of possible expected damages, the notification sent by email also includes the automatic damage scenario obtained using Escenaris (Romeu et al., 2006), along with summary tables and maps, which is only sent to civil protection services and members of the seismology unit. This fast response notification service is part of the Seismic emergency plan of the Catalonia region, SISMICAT (2003).
The most recent update to this system, when DAS declares that an earthquake with a magnitude equal or higher than 2.4 has occurred inside the Catalonia study region, a notification with the automatic information for the earthquake is sent to every user of the smartphone application SISMOCAT (Figure 1.14), developed by ICGC. This application can also be configured to receive notifications for regional and worldwide earthquakes from the Seismic Portal (http://www.seismicportal.eu/) maintained by EMSCCSEM.
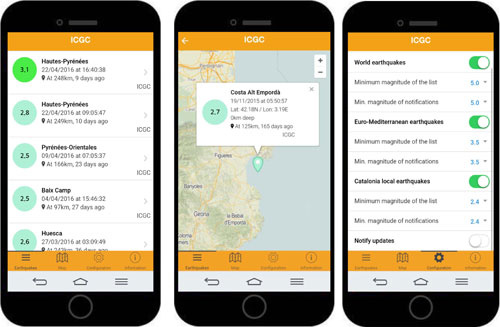
Figure 1.14. ICGC’s smartphone application for earthquake notification SISMOCAT.
As already described, if the detected earthquake is located in the Pyrenean region and its magnitude is equal or greater than 3.0, ShakeMaps are automatically published within minutes at both ICGC and SISPyr websites. As a product of the transborder collaboration the ShakeMap service for the Pyrenees region integrates the macroseismic and ground motion parameters from agencies at both sides of the frontier. This service was designed with the objective to provide unique and comprehensive information to authorities and emergency services in the case an earthquake occurs in the frontier neighbourhood. Figure 1.15 shows the ShakeMap with the intensity estimation for a M4.3 earthquake that occurred on October 29, 2015 in the Roses Gulf. The white circles indicate the real macroseismic data integrated from several agencies.
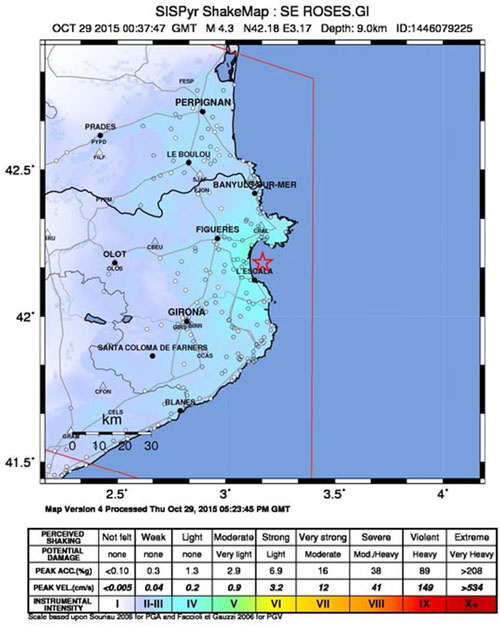
Figure 1.15. ShakeMap with intensity estimation for the M4.3 earthquake in the Roses Gulf that occurred on October 29, 2015.
After the seismologist on duty receives the automatic notification, the earthquake hypocentral data are manually verified and the information of the earthquake is updated if needed. This updated information is published on the website (Figure 1.16) and sent through email to over a list of 1000 users, mainly related to the regional administration and communication services.
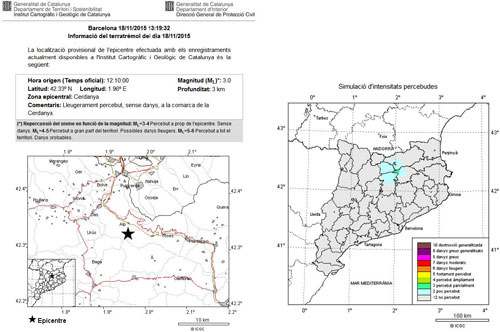
Figure 1.16. Example of earthquake notification (left) and simulation of felt intensities (right).
Macroseismic Data Collection and Dissemination
ICGC is also in charge of macroseismic data collection. A macroseismic questionnaire is available on the website, which is based on the EMS-98 scale (Grünthal, 1998). It can be filled in by anyone that felt the seismic event. Also after a felt earthquake the ICGC sends special macroseismic questionnaires to the affected municipalities in order to gather additional information.
ICGC receives all this information and determines the intensity of the earthquake. In the future an application will be developed for automatic evaluation of the questionnaires and also for users to answer the macroseismic questionnaires directly by smartphone.
All perception data are analysed and published in the website as maps and they are also included in the yearly seismological bulletins. In 1999 a Seismic Atlas of Catalonia (Susagna and Goula, 1999) was published containing the data of the earthquakes that had been felt in the region up to 1996.
1.1.6 Future Steps
As many of the stations that are part of the present-day Catalan Seismic Network were installed in the first years of this century, an update of the field equipment is already needed. It is planned to do so over several years starting in the next few months. Other future improvements deal much more with data processing than with instrumentation. Calculation of station corrections for arrival times and Ml are needed. It would be also necessary to implement an automatic virtual real time focal mechanism and Mw calculation. In relation to these items, a catalogue homogenisation, on location (already completed for the period 1984-2013) as well as Mw magnitude will be really helpful for hazard and risk estimates. Future plans include the implementation of 3D-velocity models for epicentre location.
As an important part of the recorded seismicity occurs in the Pyrenees, where a state frontier runs all over the mountain chain, it is important to enhance the already existent transfrontier collaboration. Now, and thanks to the collaboration among the seismological institutes, in case of an earthquake, authorities have access to unified information concerning accelerations and felt intensities, covering the whole chain, instead of four different partial sets belonging to different institutions (ICGC, IGN, CEALDG [Commissariat à l’Energie Atomique – Laboratoire de Détection et de Géophysique], OMP and RéNaSS [Réseau National de Surveillance Sismique]).
Another important topic is the preservation of the seismic information. At present analogue seismograms of the ICGC network from the period 1984-2000, recorded on thermic paper are scanned to ensure preservation. Also for this reason, ICGC is collaborating with the Fabra and Ebre observatories, already mentioned in Section 1.1.2, to preserve, classify and digitize the large amount of seismic information in their archives. It is envisaged to make it available on the web.
1.1.7 Data Share for Users
As already stated, raw data recorded by the network stations (BB and FBA) are freely available for any researcher. Records of a few stations are available online through ORFEUS-EIDA website (http://www.orfeus-eu.org/eida/eida.html). Other data are available on demand at xarxasismica@icgc.cat.
1.1.8 Acknowledgements
Many people, other than the authors of this document, are or have been involved in the different aspects of the management of the Catalan Seismic Network. Among them, we particularly wish to thank Sara Figueras, Albert Macau, Pere Valls, Carme Olivera, Teresa Susagna, Jorge Fleta, Jordi Pujol, Antoni Marcè and Àlex Elvira.
1.1.9 Bibliography
- Allen, R.V. (1978). Automatic Earthquake Recognition and Timing From Single Traces, Bull. Seism. Soc. Am., 68, 1521-1532.
- Allen, R.V. (1982). Automatic Phase Pickers: Their Present Use and Future Prospects, Bull. Seism. Soc. Am., 72, S225-S242.
- Batlló, J. (2003). Els antics sismógrafs de l’lnstitut de Girona, Revista de Girona, n. 216, 36-43 (in Catalan).
- Bertil, D., J. Roviró, J. A. Jara, T. Susagna, E. Nus, X. Goula, B. Colas, G. Dumont , L. Cabañas, R. Antón, M. Calvet. (2012). ShakeMap implementation for Pyrenees in France-Spain border: regional adaptation and earthquake rapid response process, Proceedings of the 15th World Conference on Earthquake Engineering, 10 p. Online at: http://www.iitk.ac.in/nicee/wcee/article/WCEE2012_2078.pdf.
- Cesca, S., F. Grigoli, S. Heimann, A. González, E. Buforn, S. Maghsoudi, E. Blanch, and T. Dahm (2014). The 2013 September–October seismic sequence offshore Spain: a case of seismicity triggered by gas injection?, Geophys. J. Int., 198 (2), 941-953. doi:10.1093/gji/ggu172.
- Delouis, B. (2014). FMNEAR: Determination of Focal Mechanism and First Estimate of Rupture Directivity Using Near Source Records and a Linear Distribution of Point Sources, Bull. Seis. Soc. Am., 104 (3), 1479-1500, doi: 10.1785/0120130151.
- Dewey, J. F., M. L. Helman, S. D. Knott, E. Turco and D. H. W. Hutton (1989). Kinematics of the western Mediterranean, Geological Society, London, Special Publications, 45, 265-283, doi: 10.1144/GSL.SP.1989.045.01.15.
- Frontera, T., A. Ugalde, C. Olivera, J. A. Jara, and X. Goula (2010). Seismic ambient noise characterization of a new permanent broadband ocean bottom seismometer site offshore Catalonia (northeastern Iberian Peninsula), Seismological Research Letters, 81 (5), 740–749, doi 10.1785/gssrl.81.5.740.
- Goula, X., C. Olivera, J. Fleta, B. Grellet, R. Lindo, L. A. Rivera, A. Cisternas and D. Carbon (1999). Present and recent stress regime in the eastern part of the Pyrenees, Tectonophysics, 308, 487-502.
- Goula, X., P. Dominique, B. Colas, J. A. Jara, J. A., A. Roca and T. Winter (2008). Seismic rapid response system in the Eastern Pyrenees, Proceedings of XIV World Conference on Earthquake Engineering, 8 p. Online at: http://www.iitk.ac.in/nicee/wcee/article/14_09-02-0020.PDF.
- Grünthal, G. (ed.) (1998). European Macroseismic Scale 1998, Cahiers du Centre Européen de Géodynamique et de Séismologie, 15, Luxembourg, 99 pp.
- ICGC (2000). Catalan Seismic Network. International Federation of Digital Seismograph Networks. Other/Seismic Network. doi:10.7914/SN/CA.
- ICGC (2013). Butlletí Sismològic 2013, Barcelona, ICGC, 66p. (in Catalan), Online at: http://www.igc.cat/web/files/butsis2013.pdf.
- Klein, F. W. (1978). Hypocenter location program HYPOINVERSE, U.S. Geological Survey Open File Report 78-694, 113 pp.
- Klein, F. W. (2014). User’s Guide to HYPOINVERSE-2000, a Fortran Program to Solve for Earthquake Locations and Magnitudes, U.S. Geological Survey Open-File Report 02-171, 148 pp.
- Lienert, B.R. and Havskov, J., 1995. A Computer Program for Locating Earthquakes Both Locally and Globally, Seismological Research Letters, 66 (5), 26-36, doi:10.1785/gssrl.66.5.26.
- Olivera, C., J. Fleta, T. Susagna, S. Figueras, X. Goula and A. Roca (2003). Sismicidad y deformaciones actuales en el NE de la Península Ibérica, Física de la Tierra, 15, 111-144 (in Spanish). Online at: https://revistas.ucm.es/index.php/FITE/article/view/FITE0303110111A. Last accessed: February 28 2016.
- Olivera, C., E. Redondo, J. Lambert, A. Riera i A. Roca (2006). Els terratrèmols dels segles XIV i XV a Catalunya, Institut Cartogràfic de Catalunya, ISBN 84-393-6961-1 (in Catalan). Available online at: http://www.igc.cat/web/files/IGC_2006_sismologia_segles.pdf.
- Richter, C. (1935). An Instrumental Earthquake Magnitude Scale, Bull. Seism. Soc. Am., 25 (1), 1-32.
- Roca, A., X. Goula, T. Susagna, J. Chávez, M. González and E. Reinoso (2006). A simplified method for vulnerability assessment of dwelling buildings and estimation of damage scenarios in Spain, Bulletin of Earthquake Engineering, 4 (2), 141-158.
- Roest, W. R. and S. P. Srivastava (1991). Kinematics of the plate boundaries between Eurasia, Iberia, and Africa in the North Atlantic from the Late Cretaceous to the present, Geology, 19, 613-616, doi:10.1130/0091-7613(1991)019<0613:KOTPBB>2.3.CO;2.
- Romeu, N., J. A. Jara, X. Goula, T. Susagna, S. Figueras, C. Olivera, and A. Roca (2006). Sistema automático de información sísmica, Proceedings 5th Asamblea Hispano-Portuguesa de Geodesia y Geofísica, 3 p. (in Spanish).
- SISMICAT (2003). Pla especial d’emergències sísmiques a Catalunya, 52p (in Catalan). Available online at: http://interior.gencat.cat/ca/arees_dactuacio/proteccio_civil/plans_de_proteccio_civil/plans_de_proteccio_civil_a_catalunya/#bloc11.Last accessed on March 8, 2016.
- SISPyr (2013). www.sispyr.eu (last accessed on March 03, 2016)
- Susagna , T. and X. Goula (1999). Atlas Sísmic de Catalunya. Vol. 1 Catàleg de sismicitat, Barcelona, Institut Cartogràfic i Geològic de Catalunya (in Catalan). Available online at: http://www.igc.cat/web/files/atles_sismic.pdf.
- Susagna, T. and J. Batlló (2008). Cent anys de sismologia a l’observatori Fabra, a Centè aniversari de la fundació de l’Observatori Fabra, Reial Acadèmia de Ciències i Arts de Barcelona, Spain, pp. 57-76 and 132-145 (in Catalan).
- Wald, D. J., V. Quitoriano, T. Heaton, H. Kanamori, C. W. Scrivner and C. B. Worden (1999). TriNet “ShakeMaps”: Rapid Generation of Peak Ground Motion and Intensity Maps for Earthquakes in Southern California, Earthquake Spectra, 15(3), 537-555.


